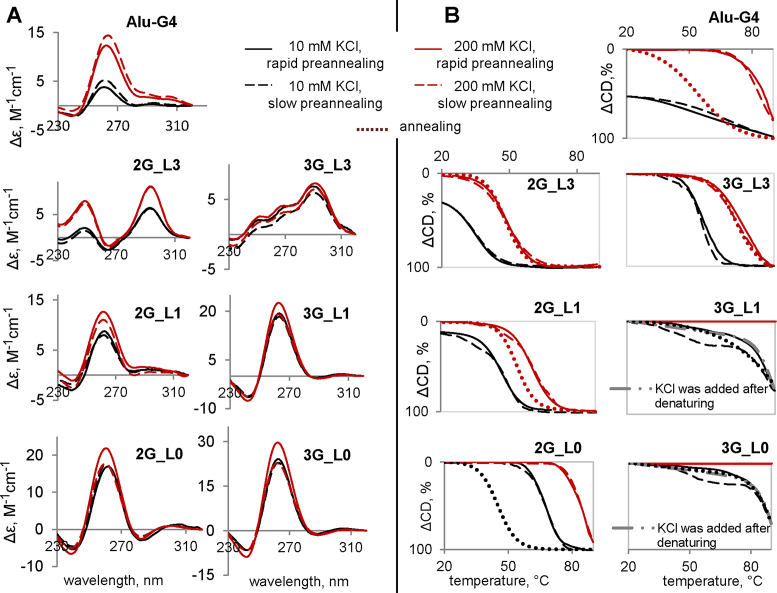
Figure 4.
CD spectra (A) and melting/annealing curves (B) of the G4s. CD spectra were recorded at 5°C. Ellipticity is given per mole of nucleotide. The ONs (5 μM) were preannealed rapidly (solid lines) or slowly (dashed lines) in the presence of 20 mM Tris–HCl (pH 7.6) and 10 mM KCl (black lines) or 200 mM KCl (red lines).

