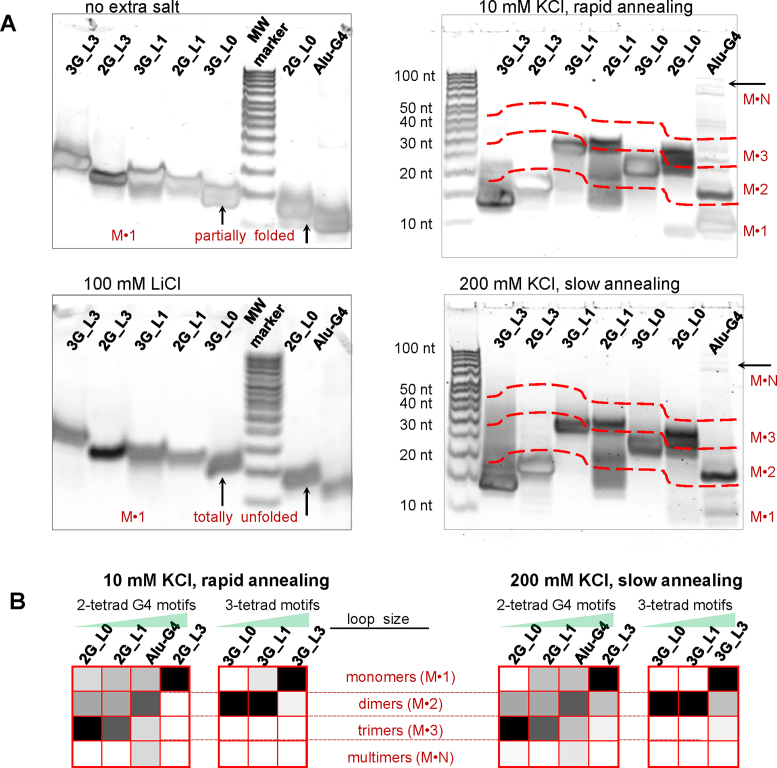
Figure 5.
Electrophoretic analysis of the G4s. (A) electrophorograms. Conditions: 100 μM ON, 20% denaturing (left) or non-denaturing (right) PAAG; standard TBE buffer (left) or TBE buffer with 10 mM KCl (right). Sample preannealing conditions are specified in the figure. The red dashed lines mark boundaries between presumed monomer, dimer, trimer and multimer zones. (B) Summary of the relative contributions of different structures revealed by PAGE. Color gradient indicates the contribution of a particular structure: from 0 (white) to 100% (black).

