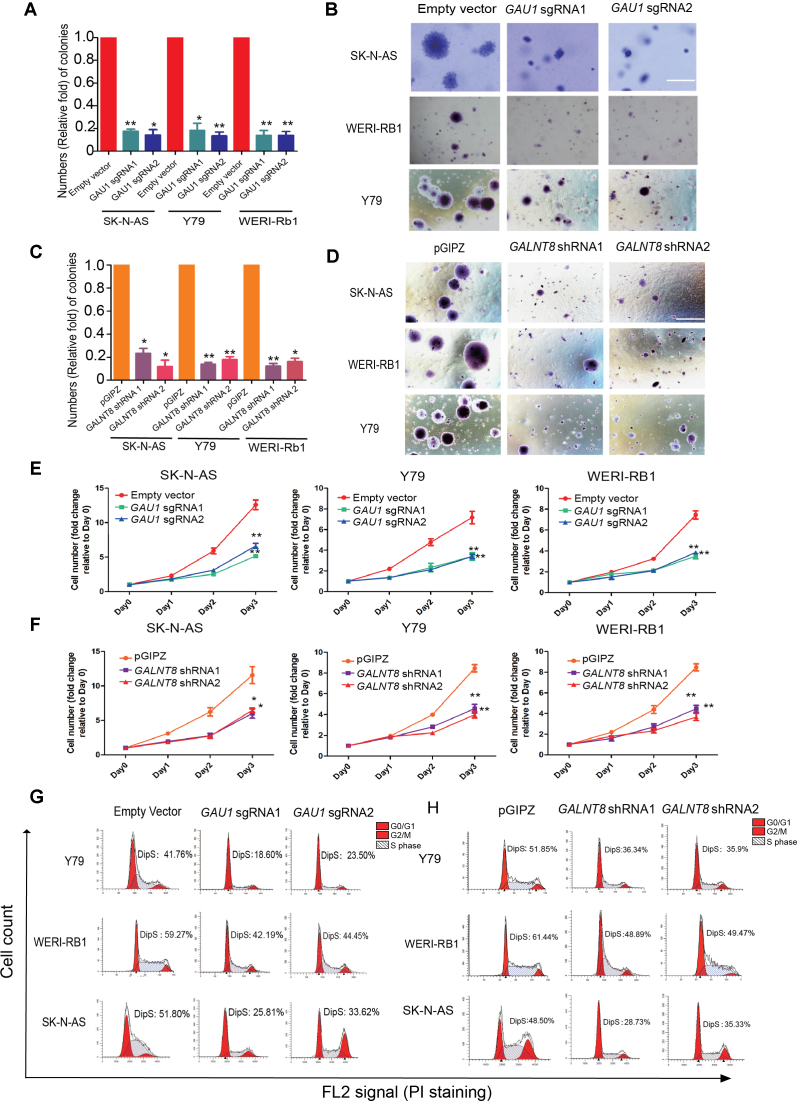
Figure 2.
The oncogenetic role of the GAU1/GALNT8 cluster in tumors in vitro. (A) Quantification of visible colonies. The colony number in the empty vector group was set as 100%. All the experiments were performed in triplicate, and the relative colony formation rates are shown as the mean ± SEM. *P<0.05 and **P<0.01; scale bar: 5 mm. (B) A soft agar tumor formation assay was performed to determine the colony formation ability of GAU1-silenced tumor cells (Y79, WERI-Rb1 and SK-N-AS). (C) Quantification of visible colonies. The colony number in the empty vector group was set as 100%. All the experiments were performed in triplicate, and the relative colony formation rates are shown as the mean ± SEM. *P< 0.05; scale bar: 5 mm. (D) A soft agar assay was performed to determine the colony formation ability of GALNT8-suppessed tumor cells (Y79, WERI-Rb1 and SK-N-AS). (E and F) CCK8 assay was performed to measure 3-day cell growth rate after GAU1 knock down. (H) CCK8 assay after GALNT8 silencing in tumor cells. (G) Flow cytometry analysis was performed to determine the percentage of cells in the different cell cycle phases. The percentage of cells in S phase decreased after GAU1 was knocked down in Y79, WERI-Rb1 and SK-N-AS cells. (H) The percentage of cells in S phase decreased after GALNT8 was knocked down in Y79, WERI-Rb1 and SK-N-AS cells. The X axial represents FL2 tunnel captured PI staining signals and the Y axial represents cell counts. Fcs data was automatically analyzed by Flowjo.

