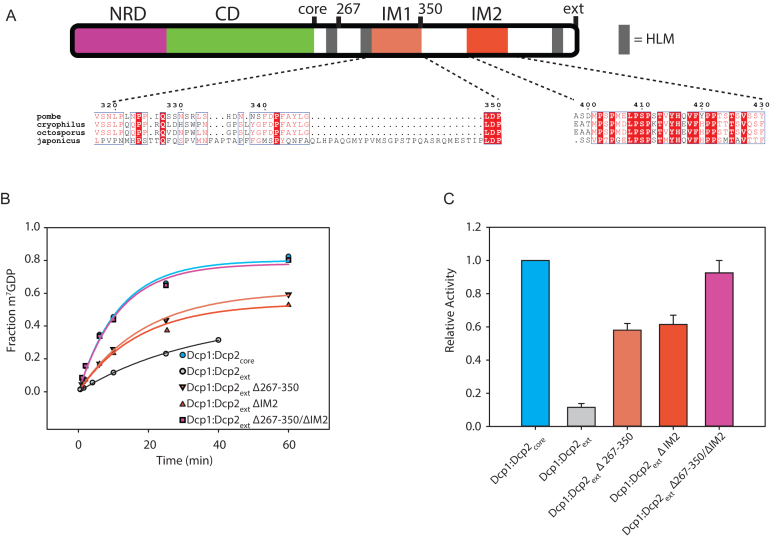
Figure 2.
Two motifs are required for autoinhibition of Dcp1:Dcp2ext. (A) Block diagram colored as in Figure 1 with IM1 and IM2 regions colored and the sequence conservation (54) for each motif shown below. IM1 contains proline and phenylalanine residues similar to the negative regulatory element identified in budding yeast (Supplementary Figure S2B), while IM2 is absolutely conserved in all fission yeast. (B) Plot with fits for fraction of m7GDP versus time comparing the activity of Dcp1:Dcp2ext where either IM1, IM2 or both are internally deleted. (C) Bar graph of the relative enzymatic activity of the various Dcp1:Dcp2ext complexes compared to Dcp1:Dcp2core. Each IM contributes to the inhibitory effect of the C-terminal regulatory region (CRR). The error bars are the population standard deviation, σ. Differences in observed rates are significant except for Dcp1:Dcp2core relative to Dcp1:Dcp2(Δ267–350/ΔIM2) and Dcp1:Dcp2(Δ267–350) relative to Dcp1:Dcp2(ΔIM2) as determined by unpaired t-test (see Supplementary Table S3).

