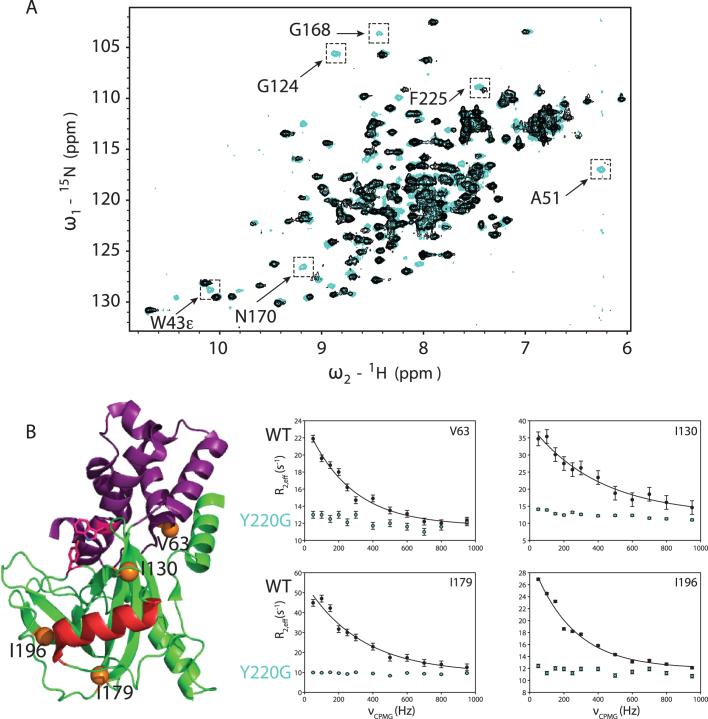
Figure 4.
Y220G mutation quenches ms-μs dynamics in Dcp2core. (A) Shown are the 15N HSQC spectra of WT Dcp2 residues 1–243 (black) and Dcp2 Y220G (cyan). Selected residues with significant changes upon mutation are indicated. (B) Location of four representative residues whose sidechain dynamics are presented are shown as orange spheres on the ATP-bound structure of Dcp2 (2QKM), where the NRD is magenta, CD is green, catalytic Nudix helix is red and W43 and Y220 are displayed as sticks. CPMG dispersion curves were recorded at 800 MHz for WT (black circles) and Y220G (cyan circles). WT data fit well to a two-site exchange model (Black lines), whereas Y220G data did not, indicating ms-μs dynamics are strongly reduced.

