Figure 6.
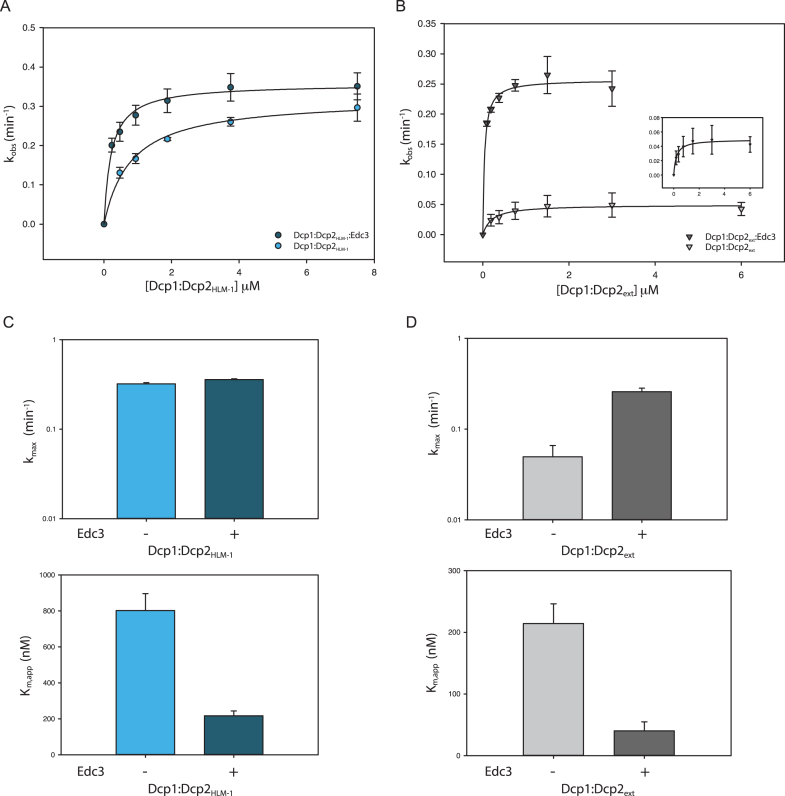
Edc3 alleviates autoinhibition and promotes RNA binding. (A) Plot of kobs versus Dcp1:Dcp2HLM-1 concentration in the absence (light blue) or presence (dark blue) of saturating concentrations of Edc3. Error bars represent population standard deviation, σ. (B) Plot of kobs versus Dcp1:Dcp2ext concentration in the absence (light gray) or presence (dark gray) of saturating concentrations of Edc3. Error bars represent population standard deviation, σ. (C) Comparison of fitted kmax (top) and Km,app (bottom) values from panel A for Dcp1:Dcp2HLM-1 with or without saturating Edc3 (colored as in panel A). There is not a significant change in kmax upon addition of Edc3 (as determined by unpaired t-test, see Supplementary Table S3) but Km,app is 5-fold decreased. (D) Comparison of fitted kmax (top) and Km,app (bottom) values from panel B for Dcp1:Dcp2ext with or without saturating Edc3 (colored as in panel B). There is a 6-fold increase in kmax upon incubation with Edc3 and Km,app decreases by 5-fold. Error bars are the population standard deviation, σ.

