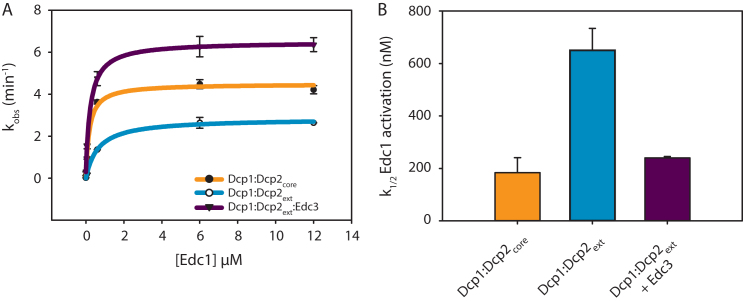
Figure 7.
Edc1 and Edc3 coordinate to activate the Dcp1:Dcp2ext complex. (A) Plot of kobs versus Edc1 concentration for the catalytic core (orange), autoinhibited complex (cyan), or the autoinhibited complex (Dcp1:Dcp2ext) saturated with Edc3 (purple). Error bars are population standard deviation, σ. (B) Bar graphs showing the K1/2 Edc1 activation (apparent Kd) determined from the fits in panel A for Edc1 dependent activation with same colors as in A. Error bars are standard error. Differences in k1/2 are significant except for Dcp1:Dcp2core relative to Dcp1:Dcp2ext:Edc3 as determined by unpaired t-test (see Supplementary Table S3).

