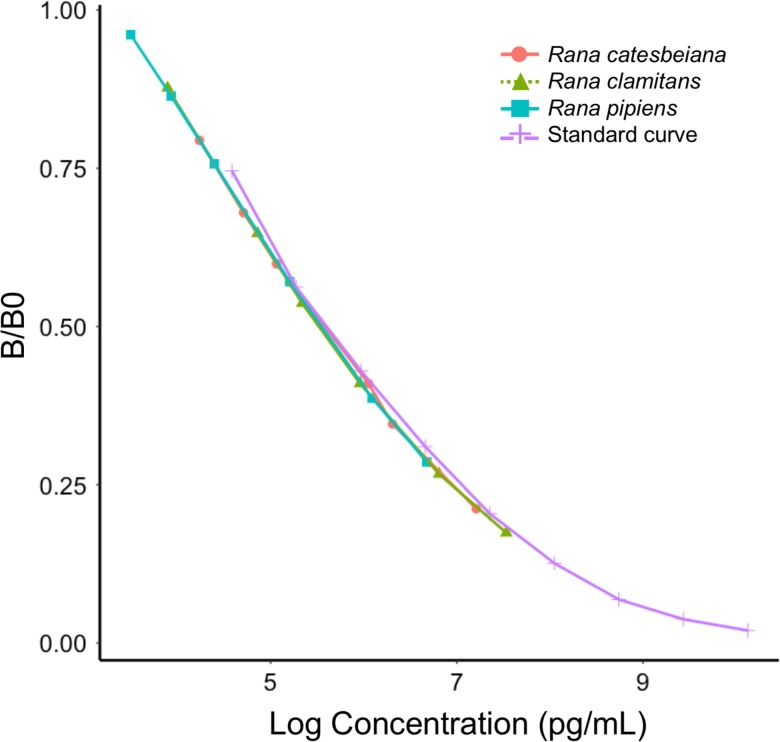
Figure 1:
Parallelism between the standard curve and serial dilutions of pooled samples from the focal species. The slope of the standard curve (purple crosses) did not significantly differ from that of 2-fold serial dilutions (1:1–1:32) from R. catesbeiana (pink circles), R. clamitans (green triangles) or R. pipiens (blue squares) samples

