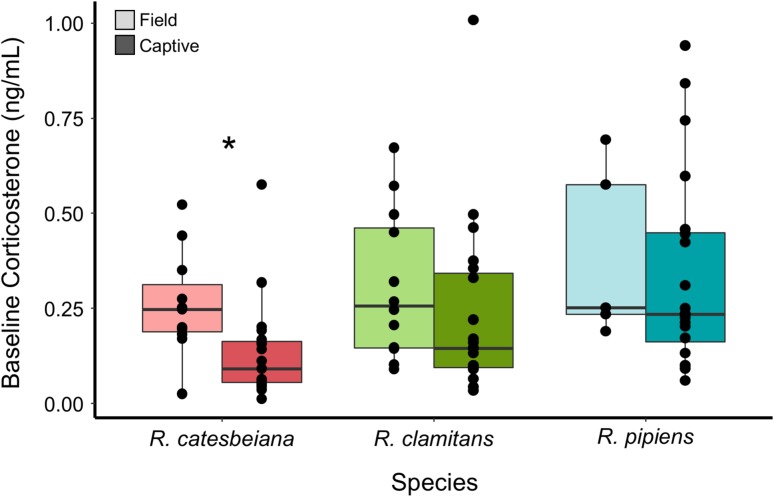
Figure 3:
Field and captive baseline salivary corticosterone levels. Box and whiskers plots showing baseline salivary corticosterone in the field (dark) and in captivity (light) for R. catesbeiana (left), R. clamitans (middle) and R. pipiens (right). A star indicates that the intraspecific comparison was significant (P < 0.05)

