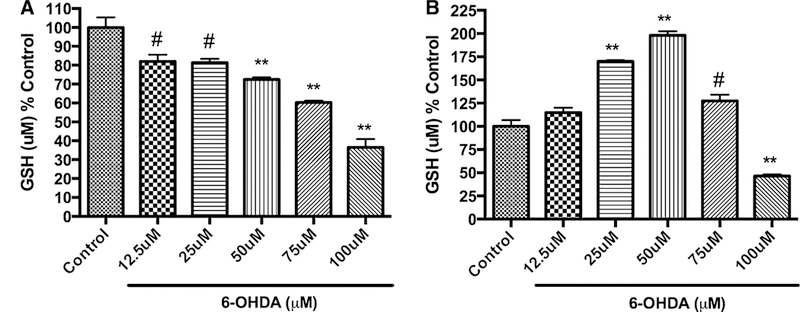
Fig. 3.

Dose-dependent effect of 6-OHDA on total glutathione levels upon treatment for 6 h (a) and 24 h (b). PC12 cells were treated with different concentrations of 6-OHDA for either 6 h (a) or 24 h (b). The values shown are the mean ± SD of at least three independent experiments performed with three replicates. One-way ANOVA analysis followed by Tukey’s multiple comparison post hoc test was performed (**p <\ 0.001, #p < 0.05 compared to control)
