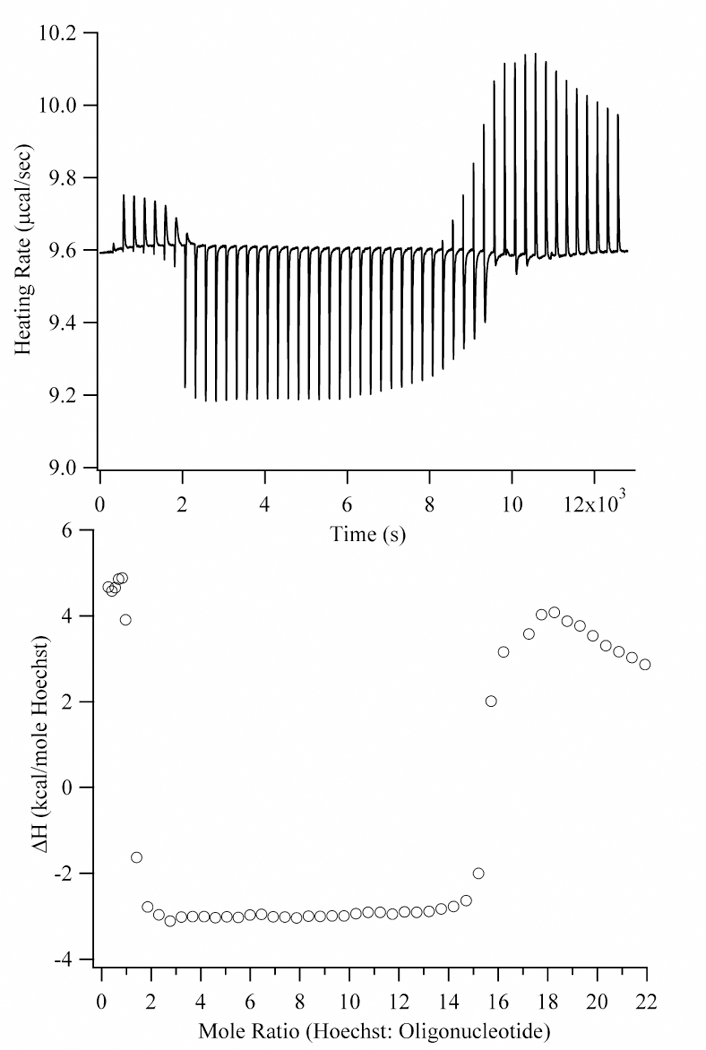
Figure 2.

Calorimetric titration of 500 µM Hoechst into 5 µM AATT at 10 °C. The upper graph describes the heating rate as a function of Hoechst addition (2 µL additions for the first 7 injections and then 6.4 µL additions). The lower graph has the integrated heats from the upper graph plotted relative to the Hoechst:oligonucleotide ratio. The heat changes at low (0 to 1), intermediate (1 to 15), and high (>15) mole ratios are attributed to minor groove binding, Hoechst aggregation on the DNA, and Hoechst dilution, respectively. An expanded view at lower stoichiometries is shown in Fig. 3.
