
Figure 4.
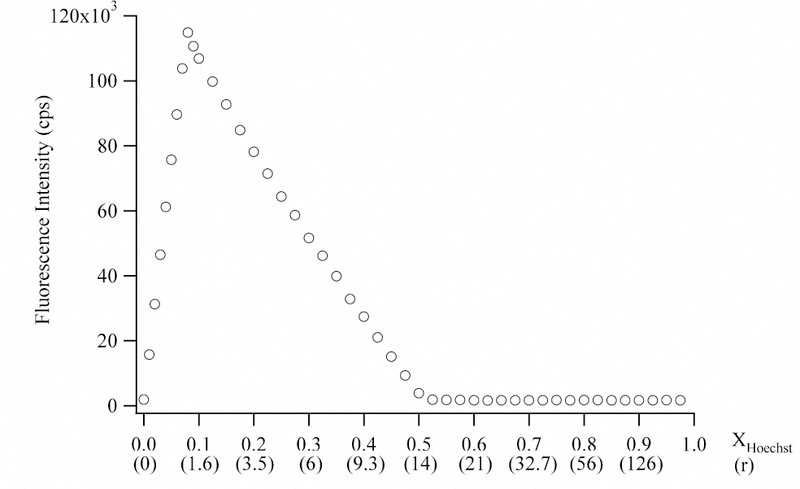
Continuous variation analysis using a total concentration of 70 µM Hoechst and base pairs (5 µM with respect to oligonucleotide) at 10 °C. The concentrations were also used in the titration shown in Fig. 2. The fluorescence intensities are plotted relative to the mole fraction with respect to Hoechst. The fluorescence emission was measured using an emission wavelength of 446 nm emission and excitation wavelength of 358 nm. In the parentheses on the x-axis, the r values (i.e. moles of Hoechst : moles oligonucleotide) are provided. The inflection point corresponding to minor groove binding occurs at 1.15 Hoechst:oligonucleotide (XHoechst = 0.076). The inflection point corresponding to aggregation occurs at 14 Hoechst : 1 oligonucleotide or 1 Hoechst : 1 base pair (XHoechst = 0.5).