
Figure 6. Homology modeling, sequence analysis, and mutagenesis of BCO1 indicate amino acid residues which contribute to the substrate specificity of BCO1.
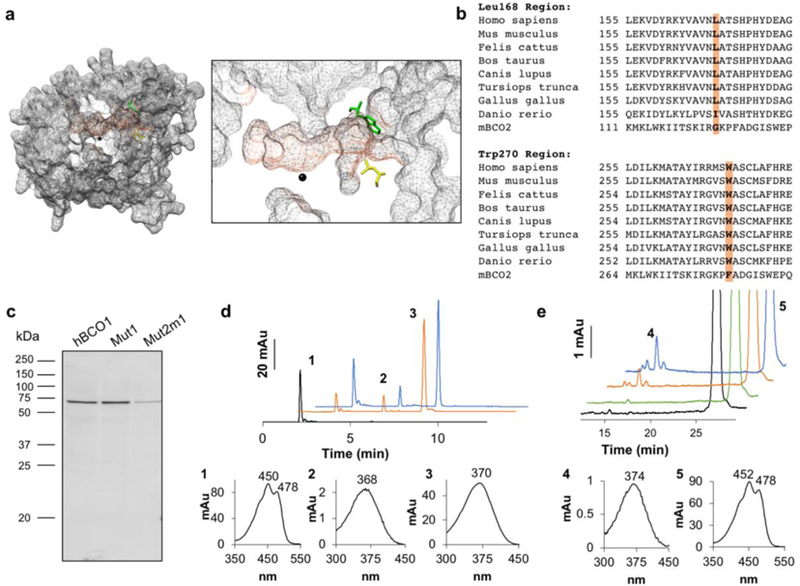
a. Surface mesh rendering of the homology model of human BCO1 (grey). The predicted substrate tunnel is highlighted (orange). At the entrance to the predicted substrate tunnel, leucine (Leu) 168 (yellow) and tryptophan (Trp) 270 (green) are shown, and the iron cofactor in the active site is indicated in black. A magnified visualization of the predicated substrate tunnel is shown on the right. b. BCO1 and BCO2 sequence alignments of different vertebrates showed that Leu168 and Trp270 are well conserved across species (orange). In BCO2 these amino acids are replaced by glycine (Gly) and phenylalanine (Phe), respectively. c. The human BCO1 mutant Trp270Phe (Mut1) and double mutant Trp270Phe + Leu168Gly (Mut2m1) as well as the original human BCO1 construct were expressed in E. coli and the expression of the proteins were confirmed by Western blotting of the crude protein extract (20 μg per lane) with an anti-His antibody. d. Mut1 and Mut2m1 protein extracts were incubated with BC. The diagram shows HPLC traces at 360 nm of BC without incubation (black), and upon incubation with Mut1 (orange) and Mut2m1 (blue). Peak 1, BC; peak 2, 13-cis-retinal; and peak 3, all-trans-retinal. The spectral characteristics of peaks 1 to 3 are shown underneath the diagram with the HPLC traces. e. Wild type (WT), Mut1, and Mut2m1 protein extracts were incubated with ZEA. The diagram shows HPLC traces at 360 nm of ZEA without incubation (black), and upon incubation with WT (green), Mut1 (orange) and Mut2m1 (blue). Peak 4, all-trans-3-hydroxy-retinal and peak 5, ZEA. The spectral characteristics of peaks 4 and 5 are shown underneath the diagram with the HPLC traces.