
Figure 1. Schematic of Distance-Based Metrics.
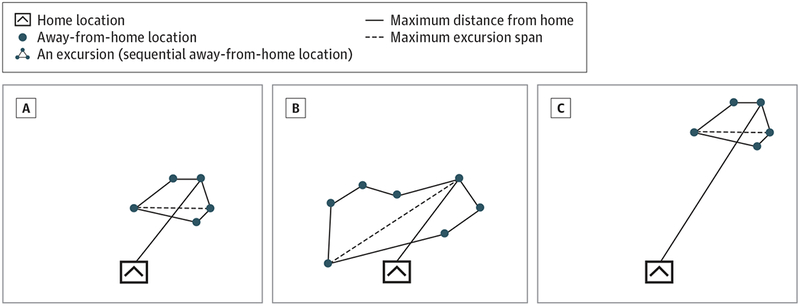
Schematic demonstrating the 2 distance-based metrics used for describing travel patterns: excursion size (maximum distance away from home) and excursion span. Three different excursion examples are shown: compact travel close to home (A), larger travel span close to home (B), and compact travel far from home (C). Comparing excursions A vs B, both excursions have the same excursion size; however, once away from home, excursion A is more compact (smaller excursion span) than excursion B. In A vs C, excursion C is further away from home; however, once away from home, both have the same excursion span. In B vs C, excursion C is further away from home than excursion B but also more compact so both excursions may have close to the same overall travel distance.