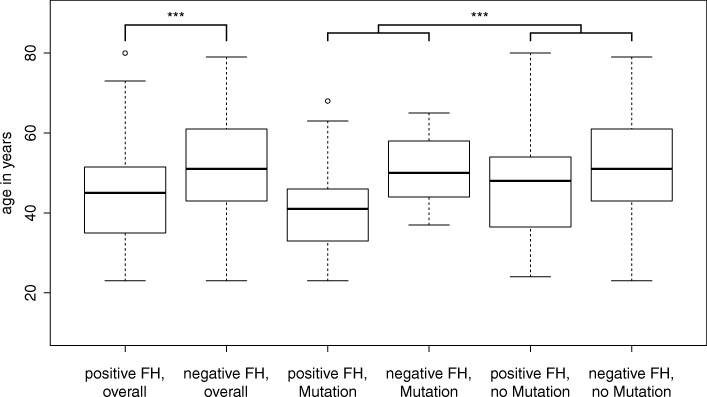
Fig. 3.
Age at first manifestation in relation to mutation status and family history. Box-plot diagram of age at first manifestation reveals that overall women with a positive family history manifest earlier than those without and that mutation positive women manifest earlier when compared to mutation negative women of their respective family history group

