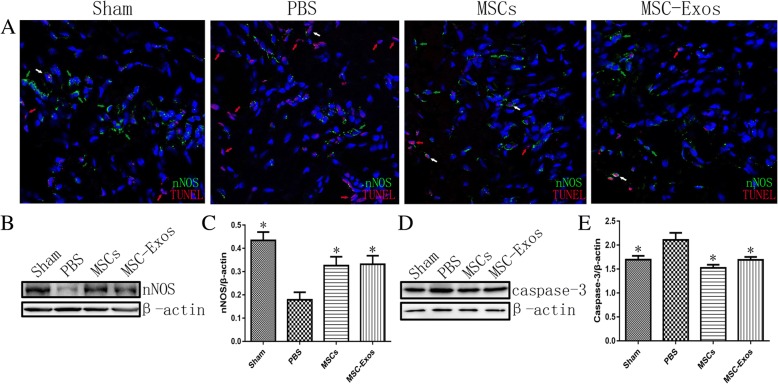
Fig. 4.
Neuronal nitric oxide synthase (nNOS) and caspase-3 expression in the cavernosum. a Representative immunofluorescence staining of nNOS (green) and TUNEL (red) in a penile midshaft specimen, 4 weeks after CNI and treatment (nNOS positive cells—green arrowheads, TUNEL positive nuclei—red arrowheads, nNOS and TUNEL both positive cells—white arrowheads). b Representative images of western blots for nNOS in cavernosum from each group. Original magnification, ×400. DAPI = 4′,6-diamidino-2-phenylindole. c Data are presented as the relative density of nNOS compared with that of β-actin. d Representative images of western blots for caspase-3 in cavernosum from each group. e Data are presented as the relative density of caspase-3 compared with that of β-actin. Each bar depicts the means ± standard deviation from n = 8 animals per group. *p < 0.05 compared with the PBS vehicle group

