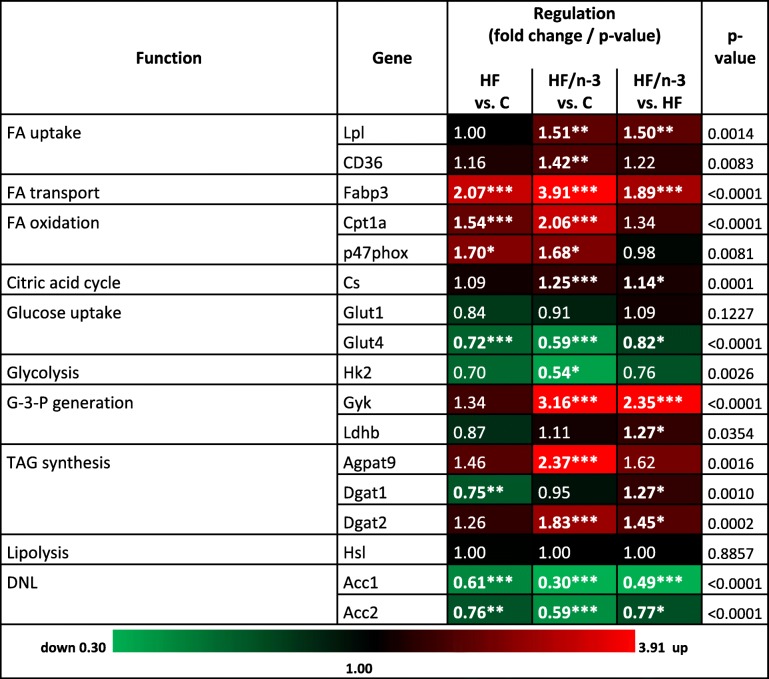
Table 3.
Summary of metabolic gene expression changes upon HF and HF/n-3 in iBAT
Expression regulations of genes with different metabolic functions in iBAT between HF and control (C) diet, HF/n-3 and C or HF/n-3 and HF. Shown are fold changes with corresponding p-values as indicated (significant differences: *p < 0.05, **p < 0.01, ***p < 0.001). Statistically significant fold changes are shown in bold. The up- and downregulated gene expression is illustrated as heatmap to facilitate the visualisation of gene expression pattern
DNL de novo lipogenesis, FA fatty acid, G-3-P glycerol-3-phosphate, TAG triacylglycerol

