Fig. 5.
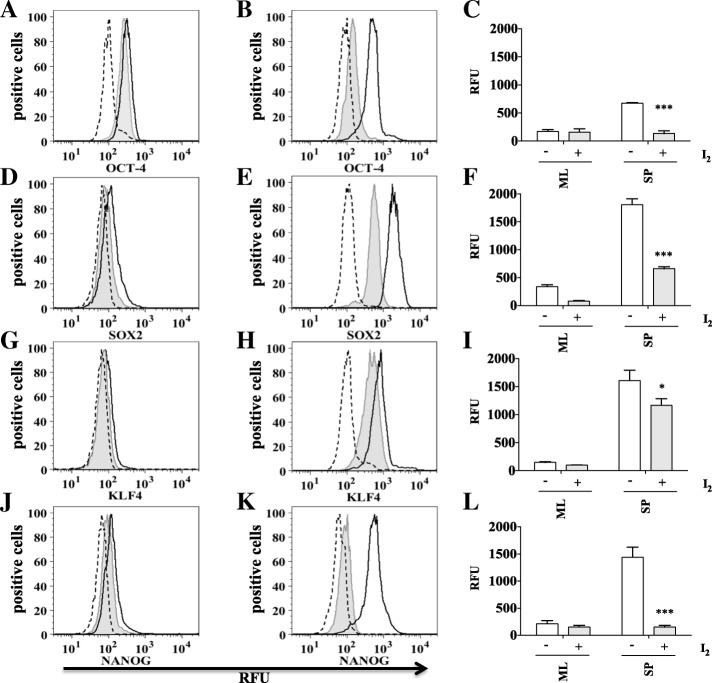
I2 treatment significantly reduces OCT-4, SOX2, KLF4 and NANOG in SiHa cells grown as spheres. Monolayer cultures of SiHa cells were treated with 200 μM (I2) for 24 h (tinted with line), without treatment (black line), isotype (long dashes) (a, d, g, j). Sphere cultures of SiHa cells were treated with 200 μM (I2) for 24 h (tinted with line), without treatment (black line), isotype (long dashes) (b, e, h, k). Markers were analyzed by flow cytometry (a, b, d, e, g, h, j, k). Data are expressed as mean ± SD (n = 3 independent assays), and the asterisk indicates a significant difference with respect to the control (*P < 0.05, ***P < 0.001) (c, f, i, l)

