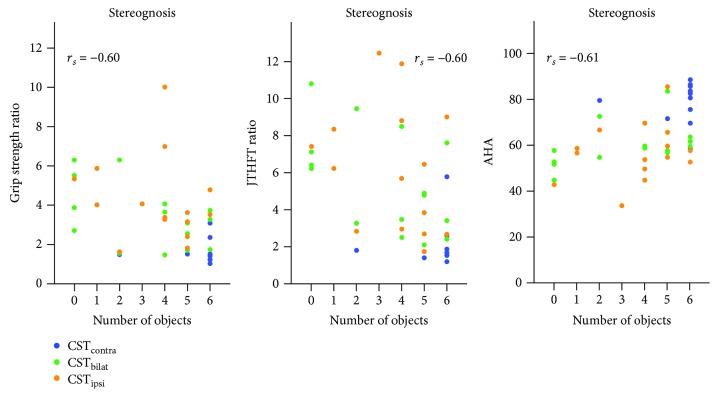
Figure 3.
The relation between motor and sensory functions seems to vary depending on the CST wiring. Individuals with a CSTcontra and CSTipsi wiring showed no low correlations, whereas those with CSTbilat showed moderate correlations. Each dot represents an individual child, with CSTcontra (blue), CSTbilat (green), and CSTipsi (orange). Correlations between stereognosis with grip strength ratio (ratio, i.e., closer to one indicates preserved grip strength), JTHFT ratio (ratio, i.e., closer to one indicates preserved grip strength), and AHA. Correlation coefficients correspond to the analysis for the whole group.

