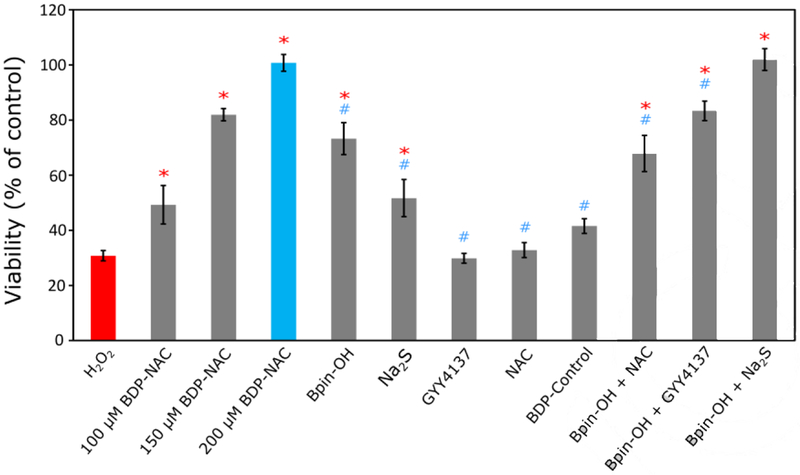
Figure 4.
Viability of H9C2 cardiomyoctyes treated with BDP-NAC or various controls and related compounds concurrent with exposure to H2O2 (100 μM) for 1 h. Each control compound was applied at a concentration of 200 μM (except for Na2S (100 μM) in the Bpin-OH + Na2S treatment group). Quantification of viability was carried out using Cell Counting Kit-8 (CCK-8). Results are expressed as the mean ± SEM (n = 10–15 for each treatment group) with 2–3 independent experiments. *P<0.01 for comparisons with the H2O2 treatment group and #P<0.01 for comparisons with the BDP-NAC (200 μM) treatment group. Group comparisons are indicated as determined by a one-way analysis of variance (ANOVA) with a Student-Newman-Keuls comparisons post-hoc test.

