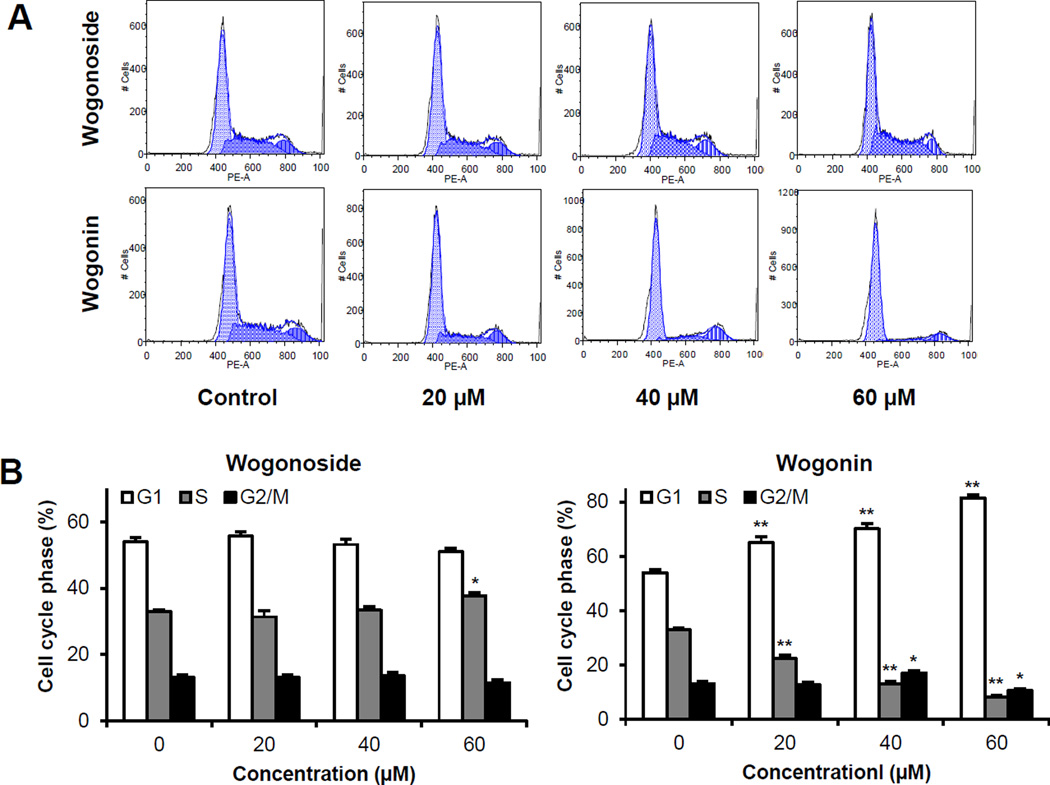
Figure 3.
Cell cycle analysis using flow cytometry after staining with propidium iodide (PI). SW-480 cells were treated with 20–60 µM of wogonoside or wogonin for 48 h. (A) Typical cell cycle profiles. (B) Data are presented as the means ± SE of triplicate experiments. *P<0.05, and **P<0.01, vs. control.

