
Figure 1.
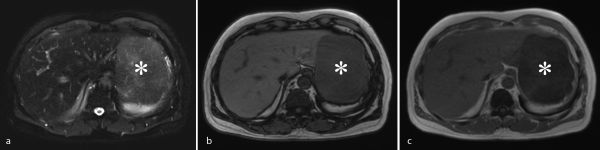
MRI of the liver shows a large mass (asterisk) at the left lobe with high signal intensity on T2 weighted image (a) and low signal intensity on opposed-phase T1 weighted image with significant signal dropout on in-phase T1 weighted image, which is representative of haemosiderin deposition (b, c).