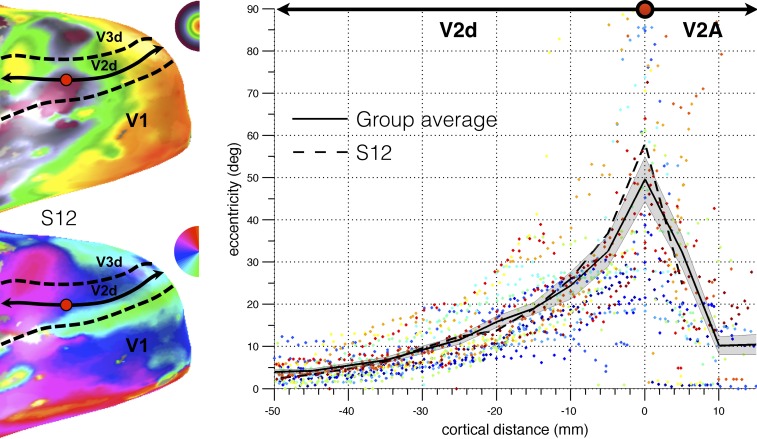
Figure 3.
Reversal in eccentricity as a function of the cortical distance along a line (illustrated for S12 in the left panel) that followed the cortical surface from the foveal representation of V2d all the way to the POS (bins of 5 mm). For each subject (plotted in different colors), cortical distance was calculated with respect to the point of maximum eccentricity such that distances in the posterior direction were negative and distances in the anterior direction were positive. The solid black line represents the data of the group average. The shaded area represents the standard error of the mean. Note that the eccentricity color map is linearly scaled in contrast to Figure 2, which has logarithmic scaling.

