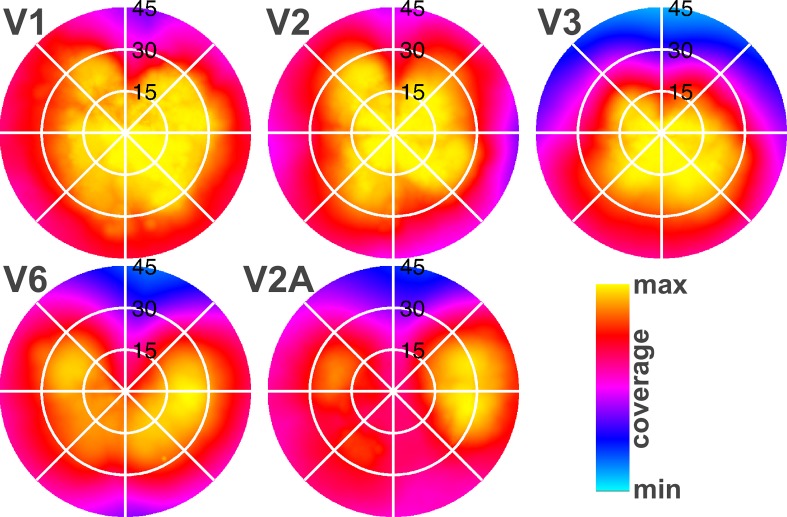
Figure 4.
Average visual field coverage maps for receptive fields of paired ROIs (ventral and dorsal quadrants combined for V1–V3) from the two hemispheres represent the entire visual field (0°–45°), indicating that V2A also represents a hemifield emphasizing the visual periphery, like V6. Yellow indicates that field coverage for these areas is found in all subjects (100%).

