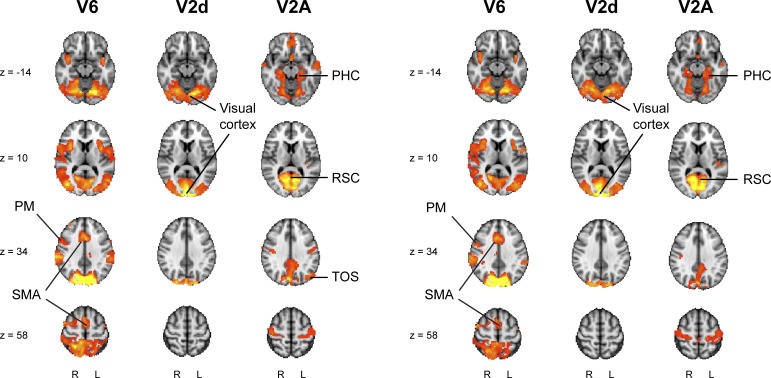
Figure 6.
Seed-based partial correlation analysis results for V6, V2d, and V2A (left panel). Maps of the t statistic are thresholded at p < 0.05 (FWE corrected). These results were replicated using resting-state fMRI data acquired on a different day in the same subjects (right panel). PM = Pre Motor area; SMA = Supplementary Motor Area; PHC = Parahippocampal Cortex; RSC = Retrosplenial Cortex; TOS = Transverse Occipital Sulcus.

