Figure 2.

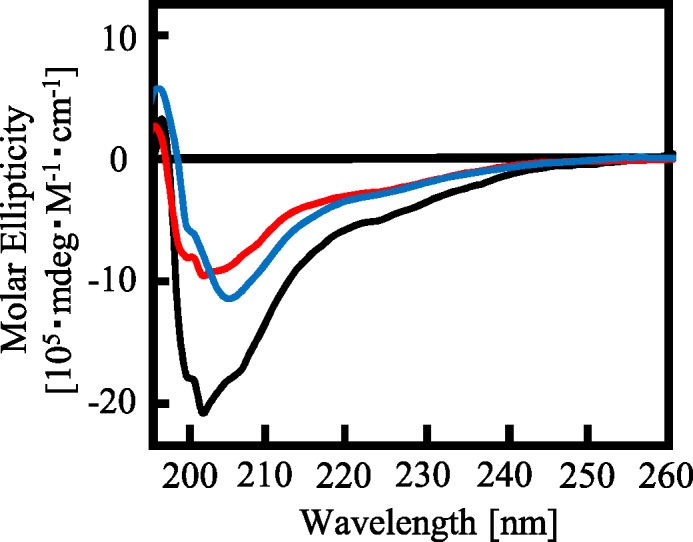
CD spectra of RGG3 purified under different buffer conditions. Line colors: black, 150 mM KCl; red, 1 M urea and 150 mM KCl; and blue, 1 M KCl. The concentration of protein was 5 μM.

CD spectra of RGG3 purified under different buffer conditions. Line colors: black, 150 mM KCl; red, 1 M urea and 150 mM KCl; and blue, 1 M KCl. The concentration of protein was 5 μM.