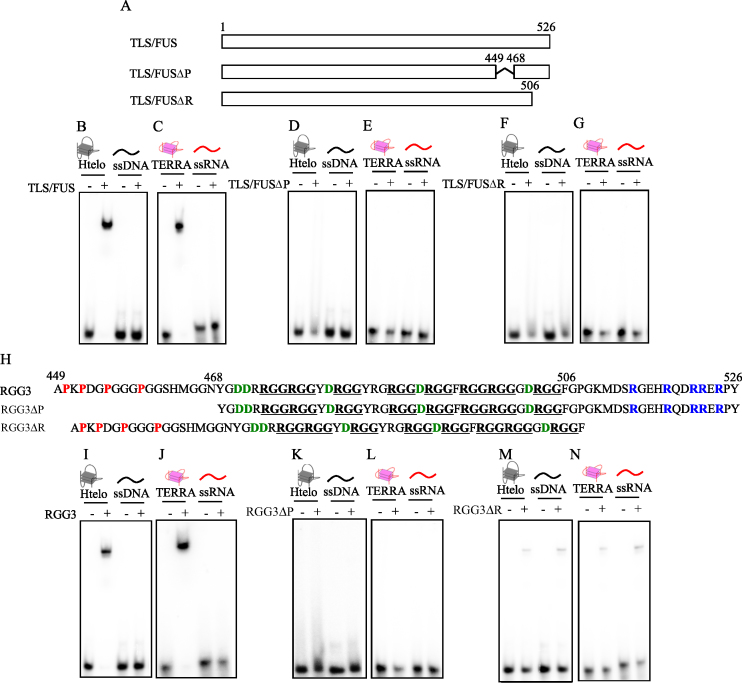
Figure 3.
Identification of the regions in TLS/FUS and RGG3 responsible for G-quadruplex binding. (A) Schematic illustration of TLS/FUS and truncated TLS/FUS (TLS/FUSΔP and TLS/FUSΔR). EMSA was performed with TLS/FUS, TLS/FUSΔP or TLS/FUSΔR, and either 32P-labeled Htelo and ssDNA (B, D and F) or TERRA and ssRNA (C, E and G). (H) Schematic illustration of RGG3 and truncated RGG3 (RGG3ΔP and RGG3ΔR). RGG sequences are underlined. Red, blue and green show proline from 449 to 448, arginine from 506 to 526 and aspartic acid from 468 to 506, respectively. EMSA was performed with RGG3, RGG3ΔP or RGG3ΔR, and either 32P-labeled Htelo and ssDNA (I, K and M) or TERRA and ssRNA (J, L and N). The nucleic acid–protein complexes were resolved by 6% polyacrylamide gel electrophoresis and visualized by autoradiography.

