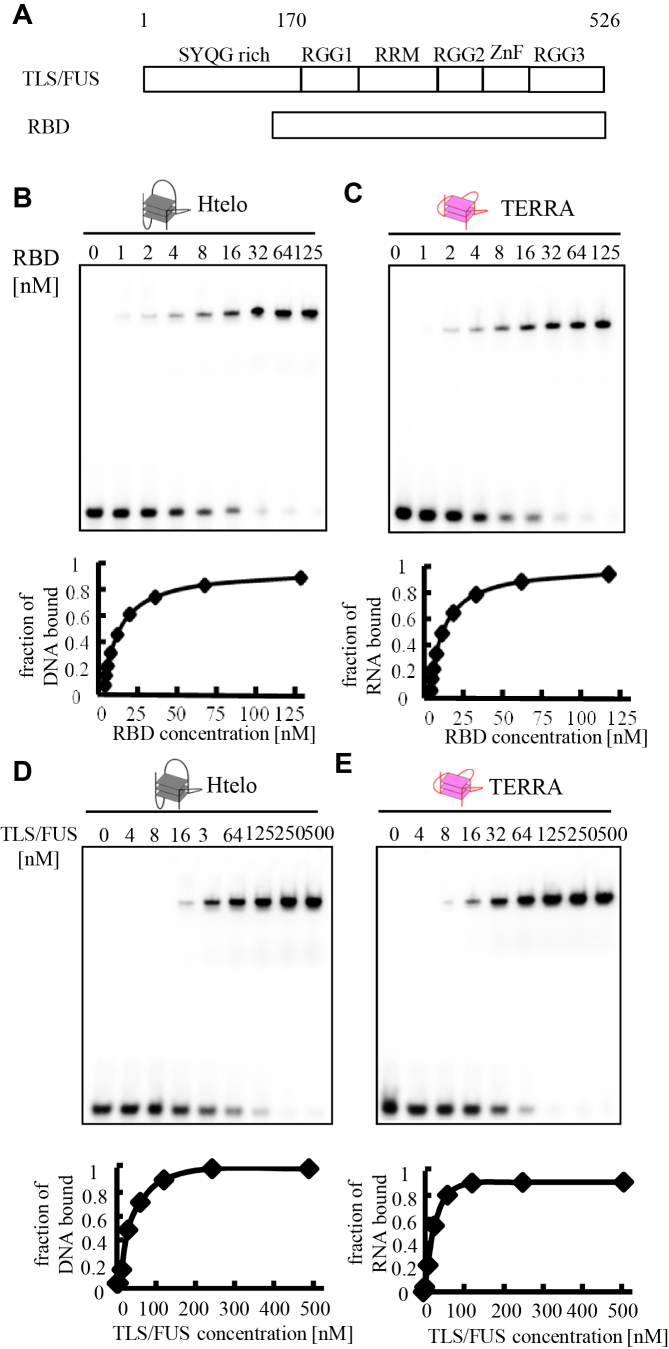
Figure 6.
Binding affinity of TLS/FUS and RBD to Htelo or TERRA. (A) Schematic illustration of TLS/FUS and RBD. The nucleic acid concentration was fixed at 1 nM while the concentration of the protein added to the binding reaction was varied, as indicated above each lane. The equilibrium-binding curve was obtained by calculating the fraction of Htelo (B and D) or TERRA (C and E) bound at each protein concentration. The binding constant (Kd) was determined by fitting to the equation. The nucleic acid–protein complexes were resolved by 6% polyacrylamide gel electrophoresis and visualized by autoradiography.

