Figure 4.
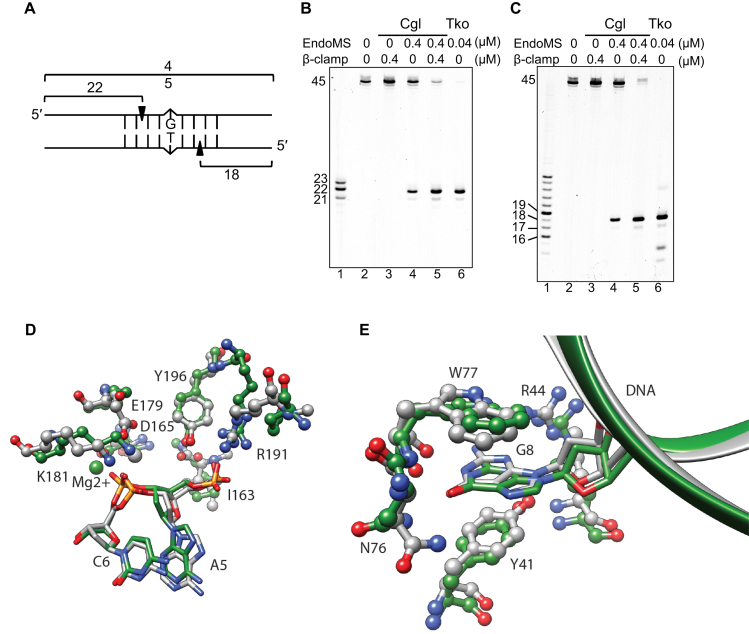
Cleavage pattern of mismatch-containing DNA by CglEndoMS. (A) The dsDNA substrate (45 bp) containing the mismatched base pair and the cleaved products are shown schematically. The 5′-Cy5-labeled upper strand (B) and the 5′-Cy5-labeled lower strand (C) were used to make the dsDNA. The numbers indicate the length of the each strand cleaved by CglEndoMS. (B and C) The substrates (5 nM) were incubated with various proteins. The products were separated by 8 M urea–12% PAGE in TBE buffer followed by laser scanning. The size markers were loaded in lanes 1 in panels b and c, and the sizes are indicated on the left side of each band. Lanes 2, no proteins; 3, 0.4 μM Cglβ-clamp (as monomer); 4, 0.4 μM CglEndoMS (as monomer); 5, 0.4 μM CglEndoMS (as monomer) and 0.4 μM Cglβ-clamp (as monomer); 6, 0.04 μM TkoEndoMS (as monomer). (D) Catalytic site structure superposition of EndoMS/NucS model (green) and template 5GKE (gray). DNA and protein are depicted in stick and ball-and-stick representations respectively. Residue numbering is relative to the template sequence. R191 is not a conserved amino acid, but in the case of CglEndoMS/NucS R173 is predicted to present a similar interaction with DNA phosphate. (E) Mismatch base recognition site structure superposition of EndoMS/NucS model (green) and template 5GKE (gray). The DNA and protein are depicted in stick-and-ribbon and ball-and-stick representations, respectively. Residue numbering is relative to the template sequence.

