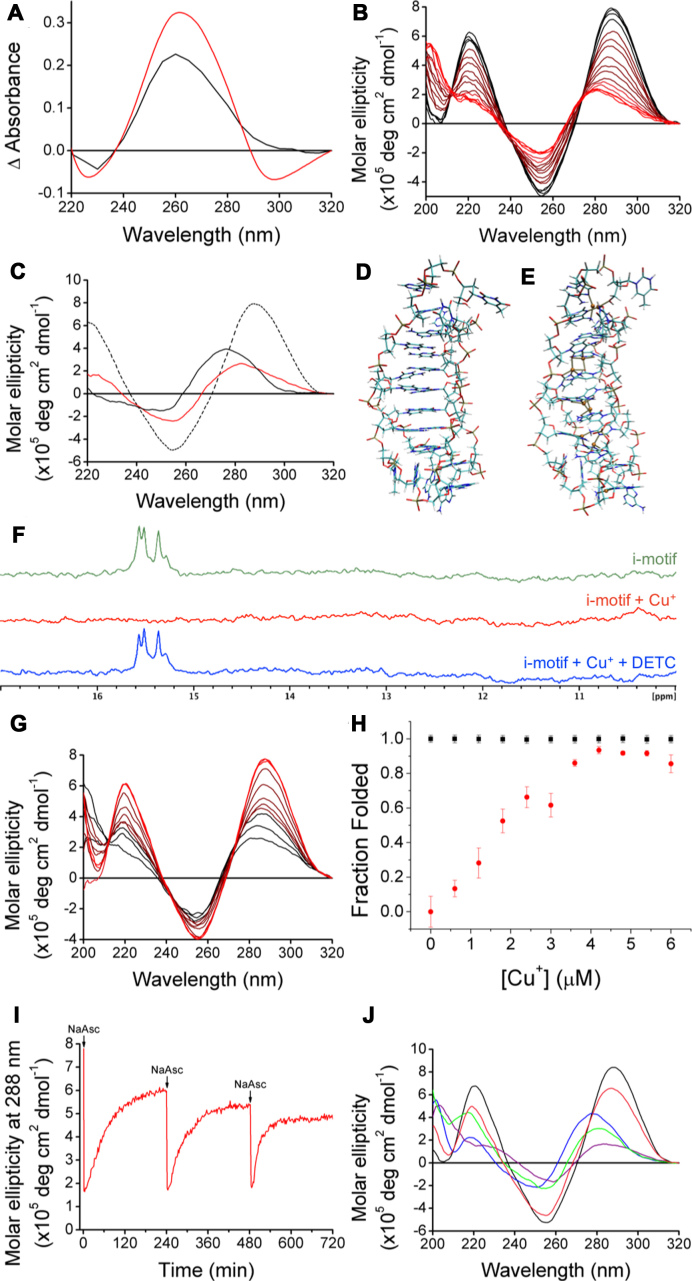
Figure 2.
(A) ‘Cu+-difference’ spectra using 125 μM of Cu+ to form the final conformations at pH 7.4 (red) and pH 5.5 (black). (B) CD spectra of 10 μM hTeloC at pH 5.5 (black) with titration up to 150 μM Cu+ (red). (C) CD spectra of 10 μM hTeloC at pH 5.5 (dashed black), after addition of 150 μM Cu+ (red) or 1 mM Cu2+ (black). (D) Model of i-motif structure stabilized by protonation of C residues, snapshot from the end of the 200 ns simulation. (E) Model of the i-motif structure stabilized by Cu+ ions, derived from (D) by geometry optimization with the PM6-D3H4 method. (F) 1H NMR of (green) 10 μM hTeloC in 50 mM sodium cacodylate buffer pH 5.5 with 5% D2O; (red) addition of 150 μM Cu+; (blue) addition of 150 μM Cu+ and 540 μM DETC. (G) CD spectra of 10 μM hTeloC with 150 μM Cu+ at pH 5.5 (black) with titration up to 300 μM DETC (red). (H) Fluorescence intensity at 25°C normalized using values in the absence of Cu+ at pH 5.5 as 1 (folded) and at pH 7.4 as 0 (unfolded). A total of 200 nM hTeloCFRET in 10 mM buffer at pH 5.5 (black) and at pH 7.4 (red). Error bars show standard deviation across three repeats. (I) Change in molar ellipticity at 288 nm of 10 μM hTeloC at pH 5.5 with 150 μM Cu2+ as a function of time with three additions of 150 μM sodium ascorbate under ambient conditions. (J) CD spectra of single sample of 10 μM hTeloC at pH 5.5 (black); addition of 1 mM Cu2+ (blue); addition of 150 μM sodium ascorbate (purple); after 4 h exposure to air (green); chelation using 1 mM EDTA (pink).

