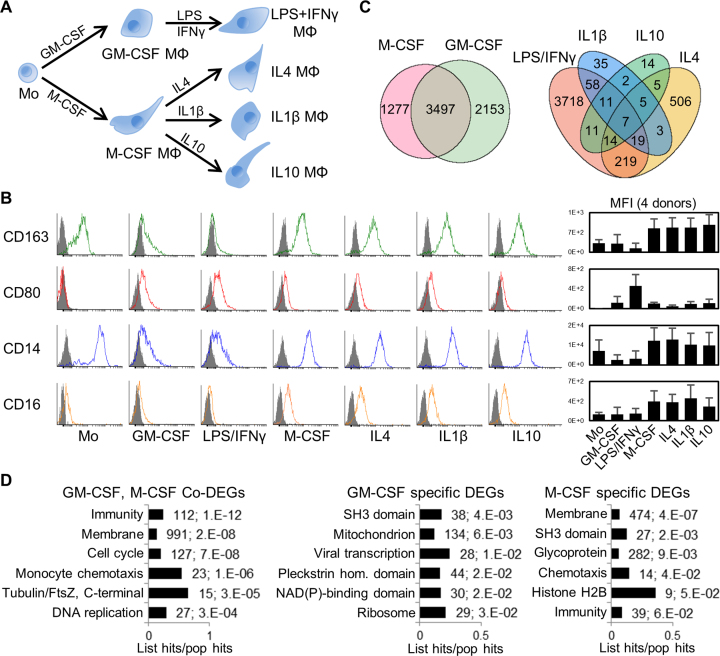
Figure 1.
Human primary monocyte differentiation protocol and differentially expressed genes (DEGs). (A) Diagram of differentiation and polarization of human primary monocytes (Mo) to macrophages (Mϕ) in culture. We performed RNA-seq for the seven monocyte and macrophage conditions. (B) Flow cytometry measurements of four representative surface markers on monocytes and macrophages (more in Supplementary Figure S2b). Right, median fluoresce intensity (MFI) of four donors. As expected, CD14 and the haemoglobin scavenger receptor CD163 in monocytes were downregulated only in GM-CSF macrophages. The T-cell co-stimulator CD80 and the Immunoglobulin G Fc receptor CD16 were upregulated only in GM-CSF or M-CSF macrophages, respectively, while CD80 is further increased by LPS/IFNγ. (C) Venn diagrams with numbers of differentially expressed genes (DEGs) with fold change ≥2 (q-value ≤0.05) for GM-CSF and M-CSF treated macrophages versus monocytes (left), and for the four polarizations (right). The enrichment of common M/GM-CSF DEGs is highly significant (P ∼ 0, one-tailed Fisher's Exact test). (D) Bar charts with the top six enriched clusters of DEGs upon M/GM-CSF stimulations, using DAVID bioinformatics resources. List hits, number of genes in our list that belong to each gene category; Population hits (pop hits), total number of genes that belong to each gene category in the whole DAVID database. Barcharts display gene category and percentage of our list hits in the population hits in the y- and x-axis, respectively. Each bar includes our list hits number and the benjamini q-value of the cluster.

