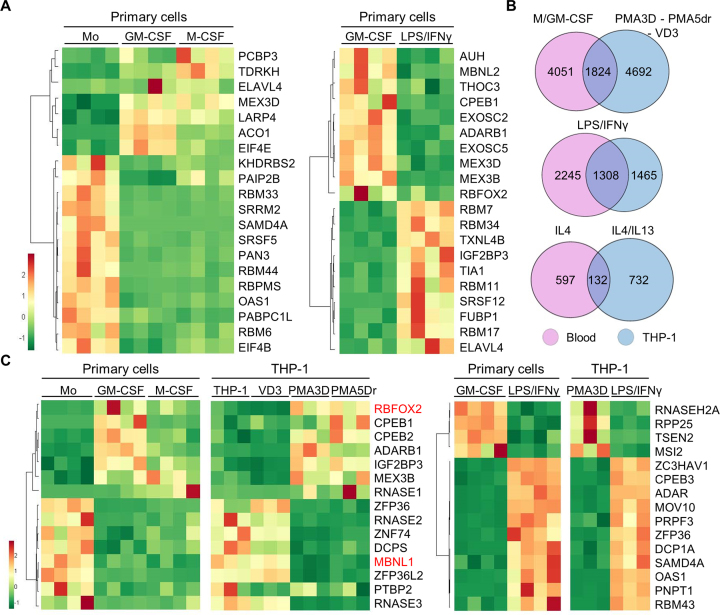
Figure 2.
DEGs common in primary and THP-1 cells, and identification of RBPs important for macrophage differentiation or polarization. (A) Heat map of mRNA expression (FPKM) for the top 20 RBPs as DEGs in primary cells, either upon M- or GM-CSF differentiation, or induced by LPS/IFNγ. The four columns under each condition represent the RNA-seq values for four donors. (B) Venn diagrams showing the proportion of DEGs with fold change ≥2 (q-value ≤0.05) between the indicated conditions in primary and THP-1 cells. We used genes instead of transcripts for this comparison. The overlap for analogous stimuli between primary and THP-1 cells is highly significant (P < 10−50 for all three tests, one-tailed Fisher's Exact test). (C) Heat map of mRNA expression (FPKM) levels for the top 15 RBPs as DEGs both in differentiation or activation of primary cells and THP-1, as labelled on top.

