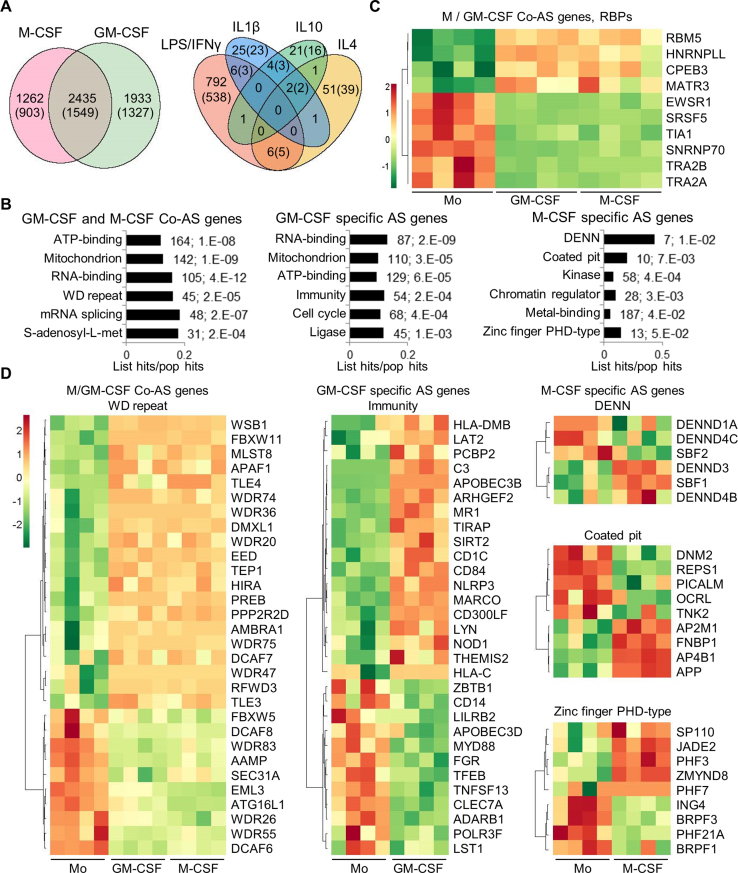
Figure 3.
Alternative splicing in primary monocyte differentiation and polarization. (A) Venn diagrams with the numbers of DASEs for differentiation and activation as indicated (PSI change ≥0.05; SpliceTrap P-value ≤0.001, MISO BFmin ≥1 & BFmedian ≥10, MATS FDR ≤0.05). In parentheses, number of genes affected by DASEs. The enrichment of common M/GM-CSF DASEs is highly significant (P∼0, one-tailed Fisher's Exact test). (B) Bar charts with the top enriched clusters of DASEs upon M- and/or GM-CSF stimulation using DAVID, as in Figure 1D. (C) Heat map showing PSI of top ten RBPs (mostly splicing regulators) as DASEs upon both M/GM-CSF treatments. Only the DASE with the highest PSI change is plotted for each RBP. (D) Heat maps for the PSI changes of DASEs in different enriched clusters of monocyte differentiation. Only DASEs with the highest PSI change (one per gene) are shown.

