Figure 4.
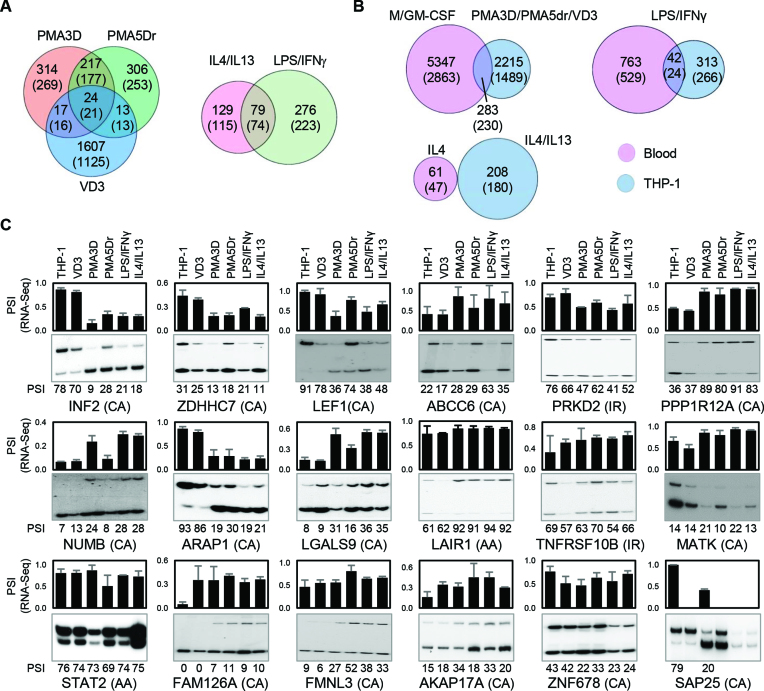
Alternative splicing in THP-1 cells. (A) Venn diagrams with the numbers of DASEs (PSI change ≥0.05; SpliceTrap P-value ≤0.001, MISO BFmin ≥1 & BFmedian ≥10, MATS FDR ≤0.05) for the indicated treatments of PMA/VD3 differentiation (left) and polarization (right). In parentheses, number of genes affected by DASEs. The PMA shared events are highly enriched, while the overlap with VD3 DASEs is also higher than expected (P ∼ 0 and P < 10−5, one-tailed Fisher's Exact test). (B) Venn diagrams showing the numbers of DASEs that are common in primary and THP-1 cells upon analogous stimuli. In parentheses, number of genes affected by DASEs. The overlaps for differentiation and LPS activation are significantly enriched (both P < 10−10, Fisher's Exact test). (C) Radioactive RT-PCR validation of DASEs identified in THP-1 differentiation. Bar chart on top shows the RNA-seq-derived PSI of each DASE with its type in parenthesis, with cassette exons (CA), intron retention (IR) and alternative 3′ splice sites (AA). The radioactive PAGE shows the RT-PCR results with their PSI quantification at the bottom of each lane. The lack of some graph bars in SAP25 is due to the lack of detection in certain conditions, yet it shows a strong reduction in cassette exon inclusion by PMA. All DASEs shown here are validated except MATK and ZNF678 (Supplementary Figure S7A).

