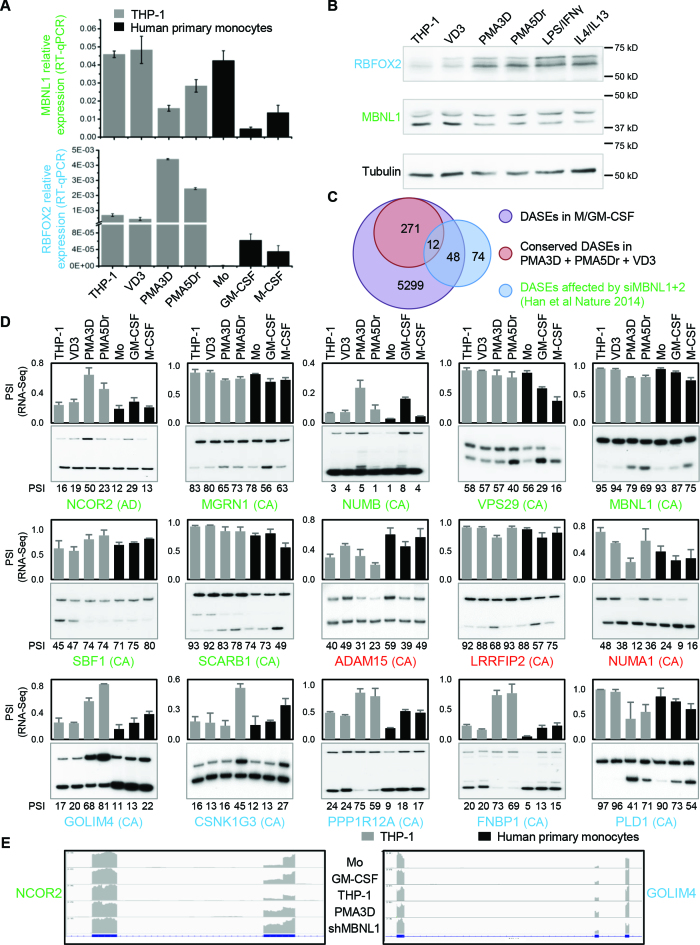
Figure 5.
Regulation of MBNL1 and RBFOX2 expression upon primary monocyte-to-macrophage differentiation and their potential AS targets. ( A) Quantitative real-time RT-PCR confirms the changes in mRNA levels of MBNL1 (top) and RBFOX2 (bottom) during THP-1 and primary cell differentiation. Y axis indicates CT values of target relative to β-Actin control. (B) Western blotting shows that MBNL1 and RBFOX2 proteins are respectively down- and upregulated upon differentiation of primary monocytes and THP-1 cells, with tubulin as loading control. (C) Venn diagram with the numbers of DASEs for primary monocyte and THP-1 differentiation versus previously identified DASEs affected by siMBNL1+2 in HeLa and HEK293T (52). The overlap is significantly enriched (P < 10−25, one-tailed Fisher's Exact test). (D) Radioactive RT-PCR validation of potential MBNL1 and/or RBFOX2 DASEs conserved in THP-1 and primary cell differentiation. AS type in parenthesis, including cassette exons (CA) and alternative 5′ splice sites (AD). Green genes indicate DASEs affected by siMBNL1+2, blue genes have one or more RBFOX2 binding sites within the target exon and/or 300nt in flanking introns, and red genes have both. Top bar chart shows the RNA-seq-derived PSI of each DASE, while PAGE shows the RT-PCR results with PSI quantification of three replicates at the bottom of each lane. All these DASEs are validated (Supplementary Figure S7B). (E) RNA-seq screenshot profiles for two DASEs, with the read density for each sequence in gray aligned to the exon(box)-intron(line) structure below.

