Figure 7.
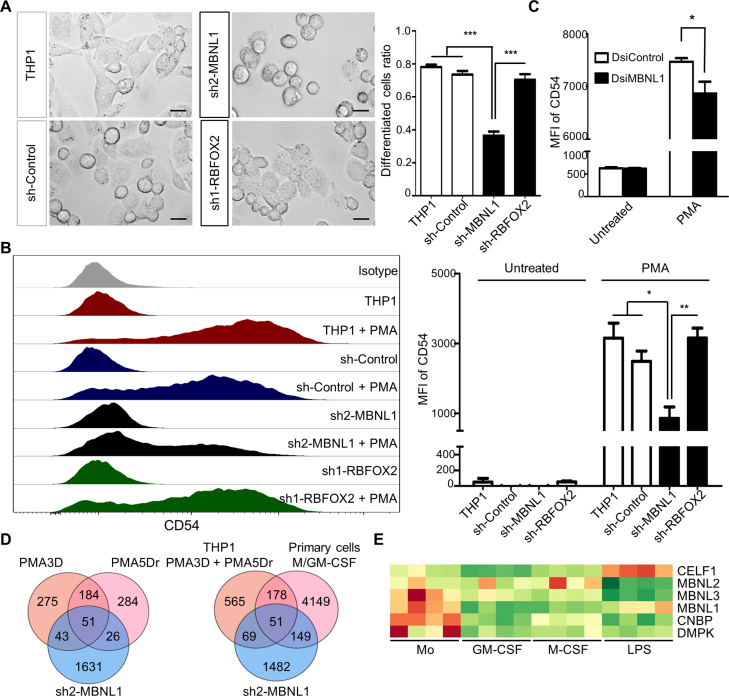
Knockdown of MBNL1 causes a strong deficiency in PMA differentiation of THP-1 cells. (A) Left, phase-contrast microscope images showing THP-1 differentiation upon PMA3D treatment, with control and shRNA-expressing cells. Right, quantification of PMA-differentiated cells. We counted the extended irregular shaped cells as differentiated, while small round cells as un-differentiated. Differentiated cells ratio = number of differentiated cells divided by total. Bar chart derived from three biological replicates with ∼100 counted cells per replicate. (B) Left, FACS profiles of CD54 expression in control, MBNL1 or RBFOX2 shRNA knockdown in untreated THP-1 and PMA3D. Right, median fluoresce intensity (MFI) of three biological replicates. (C) MFI of THP-1 and PMA3D cells treated with indicated dsiRNAs. (D) Venn diagrams of RNA-seq-detected DASEs (only with rMATS) upon MBNL1 knockdown of THP-1 cells in common with those in PMA differentiation (left) and in M/GM-CSF differentiation of primary cells (right). The overlaps between MBNL1 DASEs and those for PMA conditions or both PMA and M/GM-CSF are significantly enriched (both P < 10−30, one-tailed Fisher's Exact test). (E) Heatmap of RNA levels of MBNL1/3, CELF1, CNBP and DMPK in primary monocyte-to-macrophage differentiation and LPS/IFNγ activation, whose expression patterns suggest a possible monocyte dysfunction in myotonic dystrophies.

