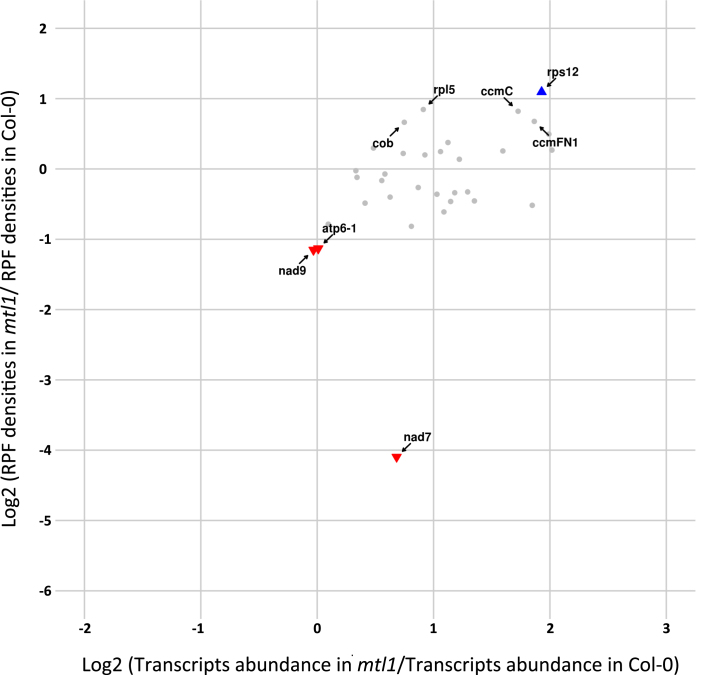
Figure 5.
Differential transcriptional and translational profiles of mitochondria-encoded mRNAs in mtl1 and wild-type plants. For each mitochondrial mRNA, relative RPF densities (Y-axis) and transcript abundance (X-axis) are reported. Genes whose names are indicated show significant changes in ribosome occupancies compared to the wild-type (P-value < 0.05). Colored triangles show genes whose changes in ribosome loads are larger than 2-fold compared to wild-type plants.

