
Figure 1.
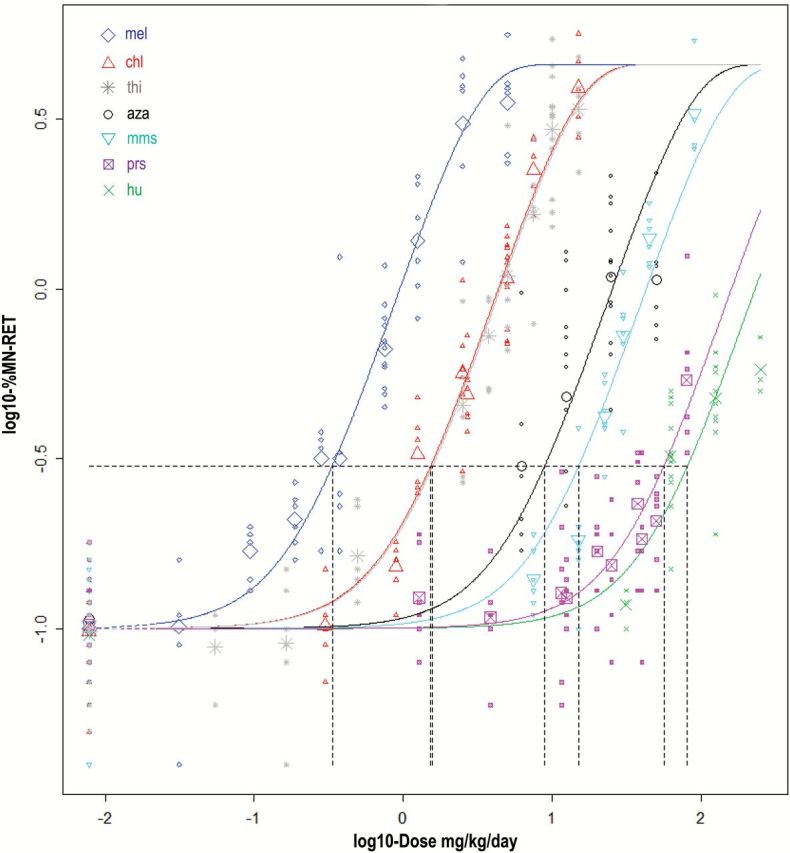
Fitted curves for in vivo MN dose–response data from seven clastogens studied in rats. The horizontal-to-vertical dashed lines represent the BMD concentrations that correspond to a BMR = 200%, that is a 3-fold induction of MN (=distance of 0.48 on log10-scale). For each chemical, the small symbols represent the individual data points and the large symbol represents the geometric mean of these observations.