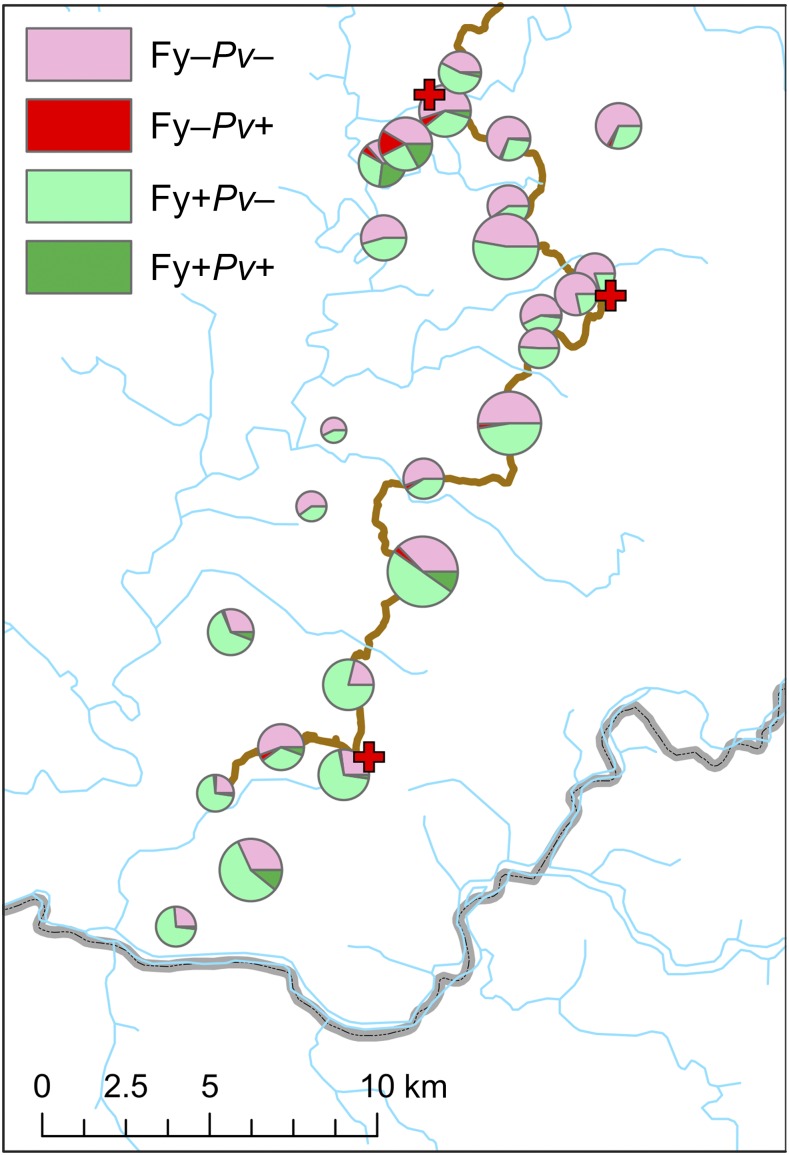
Figure 2.
Village-level summary of Plasmodium vivax infection status (from molecular diagnosis) according to Duffy phenotype. Pie chart sizes reflect the number of individuals tested by village for whom both the Duffy phenotype and P. vivax infection status data were available (range: 21–164). This figure appears in color at www.ajtmh.org.

