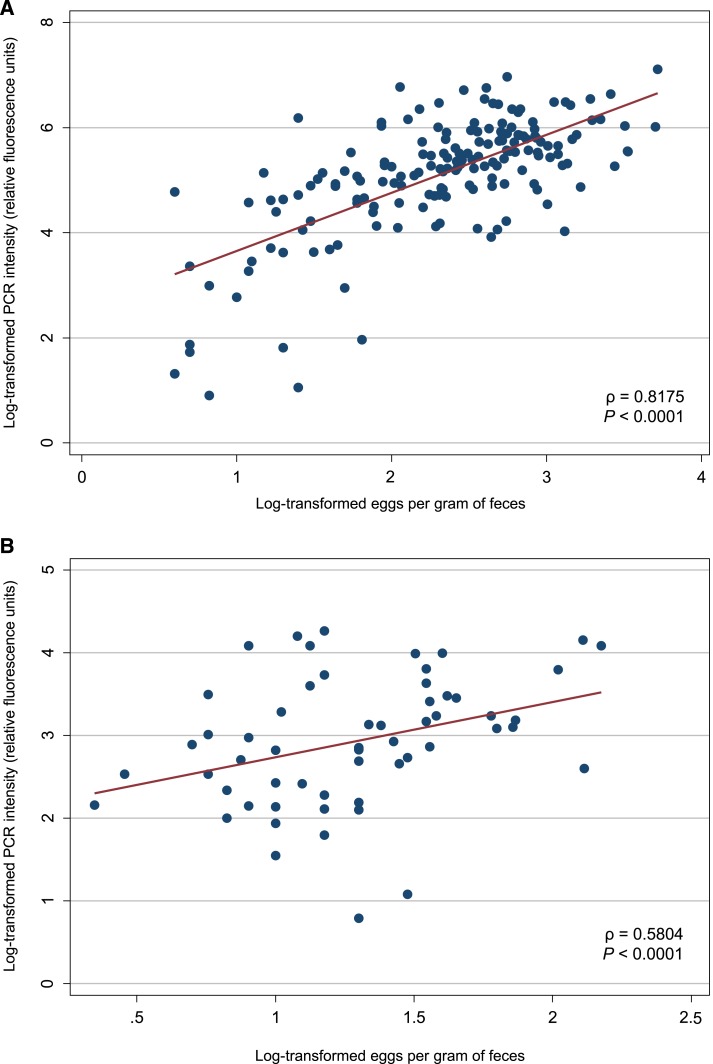
Figure 2.
Scatter plots showing the relationship between infection intensity measured by sodium nitrate flotation (eggs per gram of feces) and quantitative polymerase chain reaction (PCR) (reactive fluorescence units) on universal log10 transformation, for Ascaris spp. (A) and hookworm (B). This figure appears in color at www.ajtmh.org.

