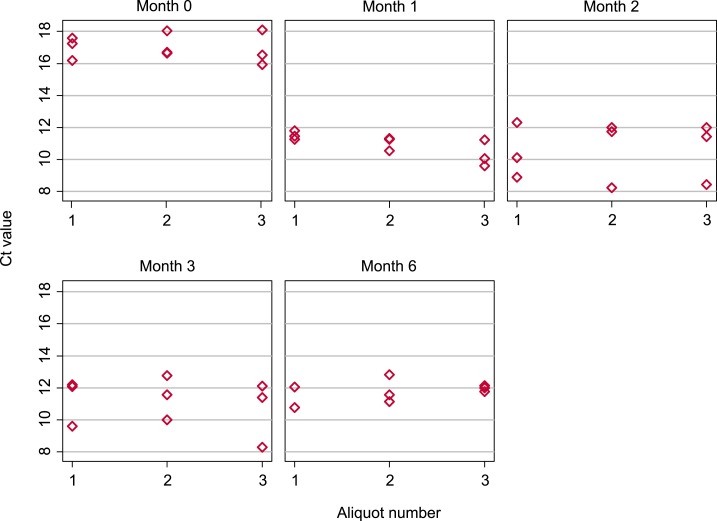
Figure 3.
Box plots showing Necator americanus cycle threshold (Ct) values obtained from individual aliquots measured at five time points following sample preservation. Three aliquots were each subjected to triplicate DNA extractions and quantitative polymerase chain reaction at each time point. This figure appears in color at www.ajtmh.org.

