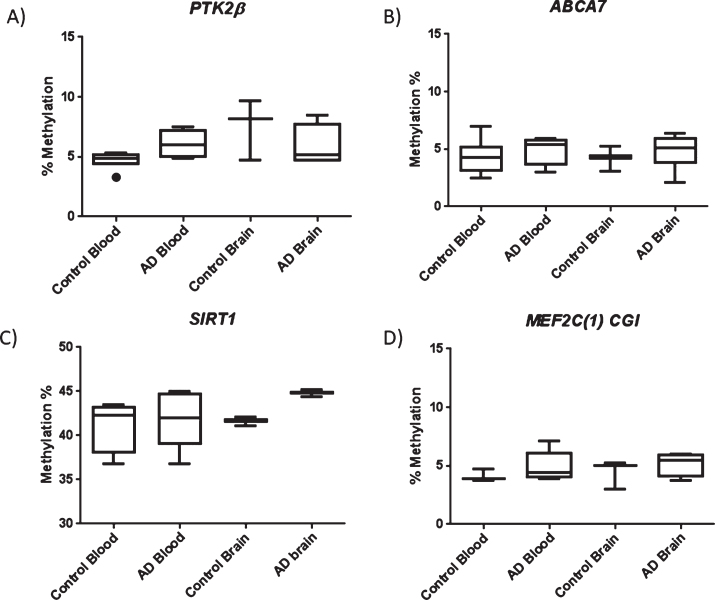
Fig.1.
Box plots showing data representing average methylation across the regions investigated for PTK2β (A), ABCA7 (B), SIRT1 (C), and the MEF2C promoter CGI (D). No significant difference in methylation was observed between AD and control in either blood or brain tissue. Box plots represent median with 25th and 75th percentile as edges, the whiskers either show the lowest and highest values or extend to the first quartile minus the interquatile range multiplied by 1.5 and up to the third quartile add the interquartile range times 1.5, depending on which values are largest or smallest (for the top and bottom whiskers respectively). For PTK2β control blood n = 6, AD blood n = 5, control brain n = 3, and AD brain n = 4. For ABCA7 control blood n = 7, AD blood n = 4, control brain n = 3, AD brain = 6. For SIRT1 control blood n = 4, AD blood n = 5, control brain n = 3, and AD brain n = 3. For the MEF2C CGI region Control blood n = 3, AD blood n = 5, Control brain n = 3, AD brain n = 4.

