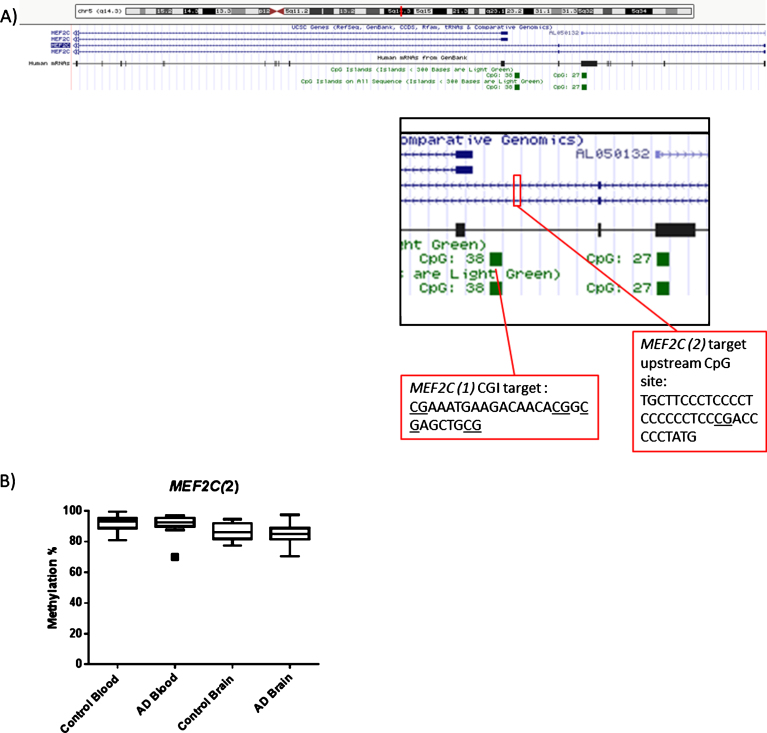
Fig.3.
(A) Diagram showing the location of MEF2C(1) and MEF2C(2) targets within the MEF2C gene. (B) In terms of the second region of MEF2C investigated no obvious collective group wide differences between Control and AD at this CpG site were observed. Box plots shows median with 25th and 75th percentile as edges, the whiskers extend to the first quartile minus the interquatile range multiplied by 1.5 and up to the third quartile add the interquartile range time 1.5. Control blood n = 26, AD blood n = 25, Control brain n = 10, AD brain n = 14.

