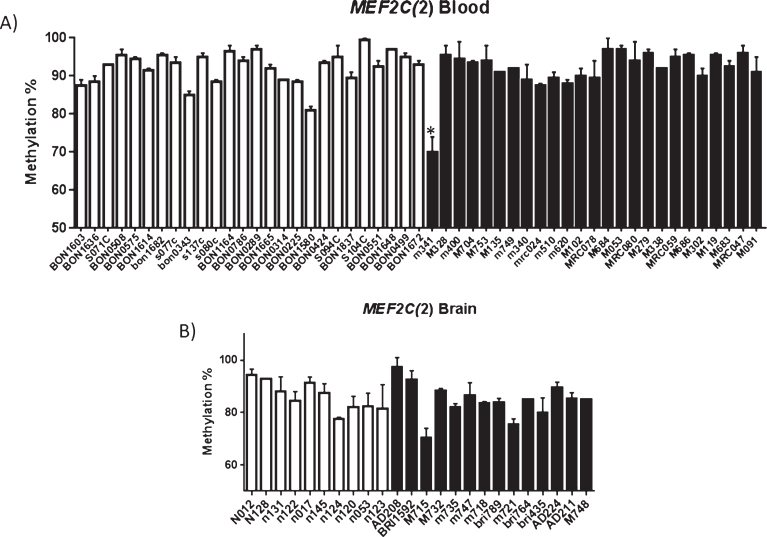
Fig.4.
(A) Methylation profiling identifies rare individual AD hypomethylation of the upstream MEF2C CpG site. Patient sample M341 showed statistically significant difference in methylation (p = 2.0E-10) when compared to other blood samples (A), statistical significance was not observed for patient M715 in brain (B). A) Shows average methylation at the CpG investigated in each sample investigated (average of at least two runs). Controls are shown in white and AD samples in black. Error bars represent the S.E.M. Control blood = 26, AD blood n = 25, control brain n = 10, AD brain n = 14; Male brain n = 10, Female brain n = 14, Male blood n = 29 0, Female blood n = 22.

