Figure 3.

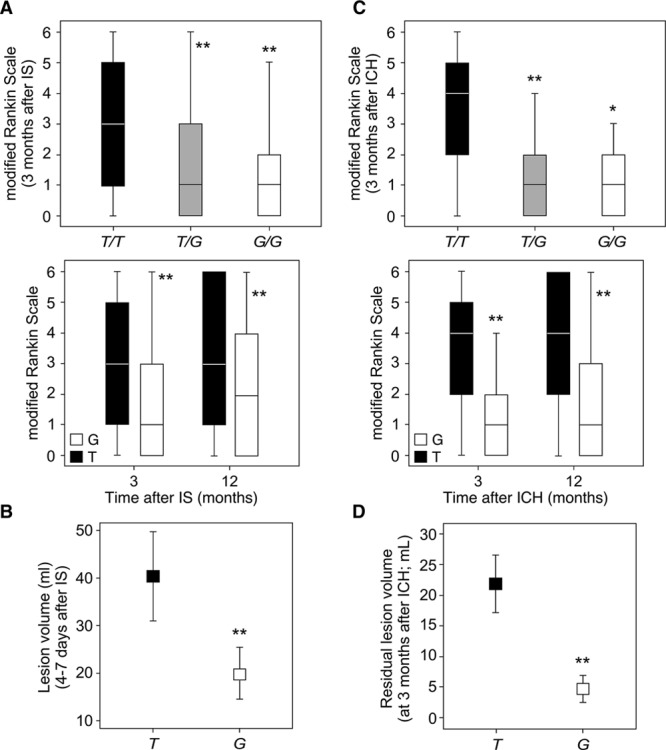
MDM2 SNP309 determines volume lesion and functional outcome after stroke. A and B, The ischemic stroke (IS) cohort included 408 patients (T/T: 225; T/G: 149; G/G: 34). A, Patients harboring the T/T genotype (T group) showed higher median mRS scores at 3 and 12 mo after IS, when compared with T/G and G/G (G group) patients. B, The infarct volume was higher in T/T patients (T group) than in the G group (T/G+G/G). C and D, The intracerebral hemorrhage (ICH) cohort included 128 patients (T/T: 76; T/G: 44; G/G: 8). C, Patients harboring the T/T genotype (T group) showed higher median mRS scores at 3 and 12 mo after ICH, when compared with T/G and G/G (G group) patients. D, The residual lesion volume was higher in T/T patients (T group) than in the G group (T/G+G/G). A and C, Box plots show median values (horizontal line inside the box), quartiles (box boundaries), and the largest and smallest observed values (error bars). B and D, Data are expressed as mean±SD. *P<0.05, **P<0.0001 compared with T/T or T group.
