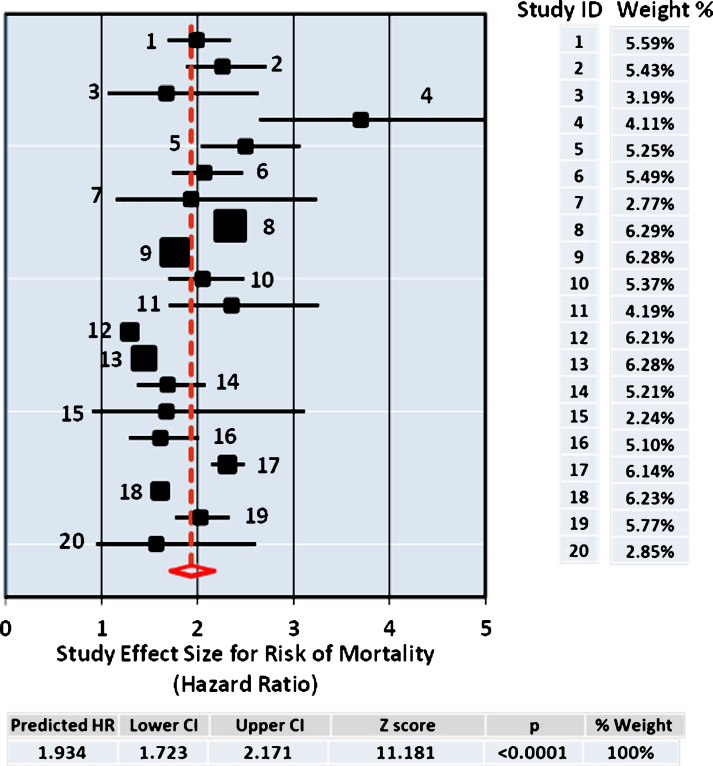
Fig.1.
Forest Plot. The size of the squares represent point estimates for magnitude of effect size (HR), scaled based on their precision (1/Standard Error). The diamond displays the estimated overall mean based on the random-effects meta-analysis (REMA) model with the width defining the 95% CIs. The horizontal lines across each square show 95% CI’s. Sample % weight is indicated on the right for each study (ID) used in the estimation. The pooled estimate from the DerSimonium-Laird analysis for the predicted HR is shown underneath.

