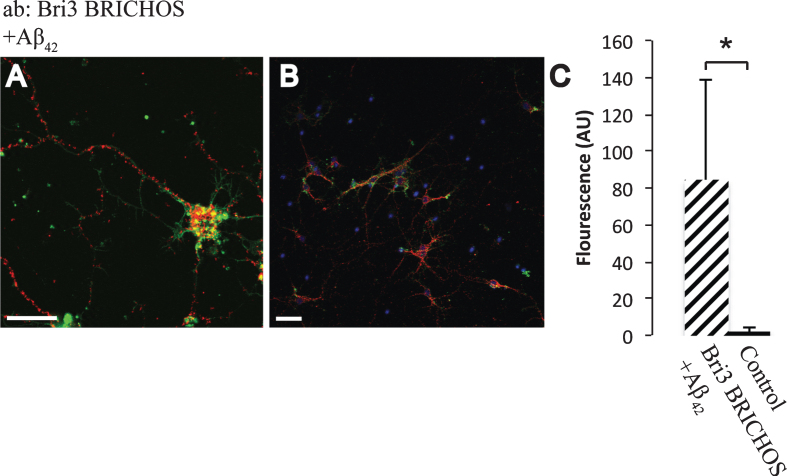
Fig.6.
Interactions between Aβ42 and Bri3. A,B) PLA signals (red) for protein interactions with anti-Bri3 BRICHOS and anti-Aβ42 antibodies. Staining of nuclei is performed with DAPI (blue) and filamentous actin is stained with phalloidin (green). Scale bar 20 μm. C) Fluorescence intensity quantification for negative controls (black bar) and Bri3 BRICHOS plus Aβ42 (hatched bar), n = 5; *p < 0.05. Average values and errors represent standard deviations. The results are representative of at least three independent experiments.

