Figure 2.

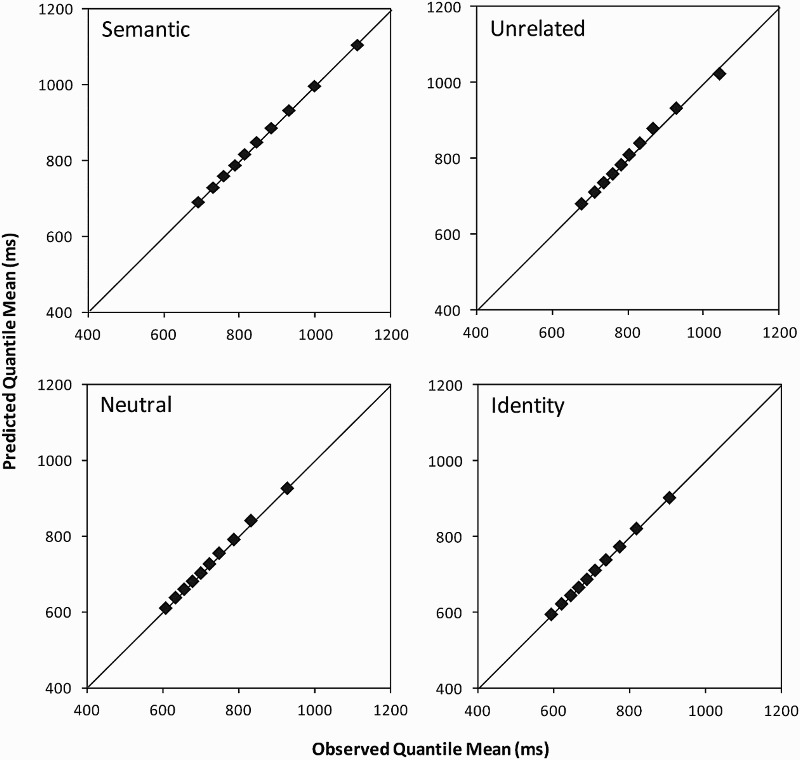
Quantile–quantile (Q–Q) plots for each distractor condition in the experiment. For each decile, the mean response time predicted by the estimated ex-Gaussian parameters is plotted against the empirically observed mean response time.

Quantile–quantile (Q–Q) plots for each distractor condition in the experiment. For each decile, the mean response time predicted by the estimated ex-Gaussian parameters is plotted against the empirically observed mean response time.