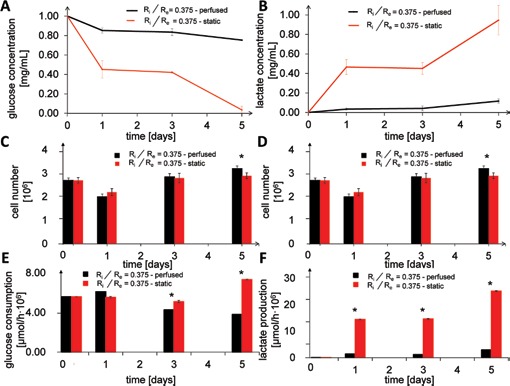
Fig. 5.

Results of the chemical analysis. (A) Glucose concentration profiles for scaffolds provided with a channel (Ri/Re = 0.375) cultured in the perfused bioreactor and under static conditions measured by HPLC. (B) Lactate concentration profiles for scaffolds provided with a channel (Ri/Re = 0.375) cultured in the perfused bioreactor and under static conditions measured by HPLC. (c, d) Number of cells estimated in the scaffold provided with a channel = 0.375) cultured in the perfused bioreactor and under static conditions. (E) Glucose consumption per million of cells estimated in the cell-populated scaffold provided with a channel (Ri/Re = 0.375) cultured in the perfused bioreactor and under static conditions. (F) Lactate production per million of cells estimated in the cell-populated scaffold provided with a channel (Ri/Re = 0.375) cultured in the perfused bioreactor and under static conditions. * p<0.01
