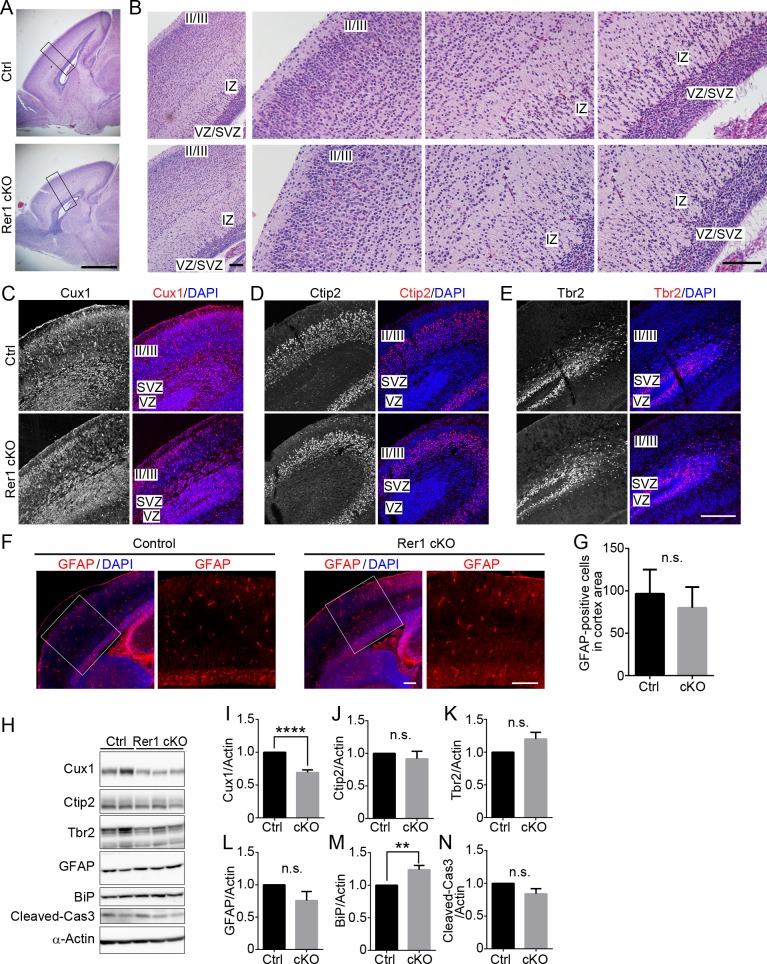
Fig 2. Rer1 deficiency causes cerebral cortex malformations during cortical development.
(A) Hematoxylin and eosin (H&E)-stained sagittal cerebral sections of P0 brains from male control (Rer1+/inv-trap) and forebrain-specific Rer1 cKO mice (Rer1inv-trap/inv-trap; Emx-Cre). Scale bar, 1 mm. (B) Enlarged views of H&E-stained sections of cerebral cortex in panel A. Small pyramidal neurons and stellate neurons were relatively sparse in layer II/III of the forebrain-specific Rer1cKO brain. IZ: intermediate zone, SVZ: subventricular zone, VZ: ventricular zone. Scale bar, 100 μm. (C-E) Immunohistochemistry of layer markers (red) in the cortex of control (Rer1+/inv-trap) and Rer1 cKO (Rer1inv-trap/inv-trap; Emx-Cre) mice on E17.5. Cryosections were immunostained with anti-Cux1 (layers II-IV; C), anti-Ctip2 (layer V; D), and anti-Tbr2 (intermediate progenitors in the SVZ; E) antibodies. Nuclei were stained with DAPI (blue). Scale bar, 200 μm. (F) Immunohistochemistry of GFAP (red) in the cerebral cortex of control and forebrain-specific Rer1 cKO mice on E18.5. Cryosections were immunostained with an anti-GFAP antibody (red). Nuclei were stained with DAPI (blue). Scale bar, 200 μm. (G) Graph show quantitative analysis of GFAP-positive cells in control (Ctrl, black bar) or forebrain-specific Rer1 cKO (cKO, gray bar) cortex on E18.5. Error bars indicate the standard error of the mean (SEM) of six mice. n.s.: not significant (Student t-test). (H) Immunoblot analysis of Cux1, Ctip2, Tbr2, GFAP, BiP, and cleaved Caspase-3 in the cerebral cortex of control and forebrain-specific Rer1 cKO mice. Homogenates of dissected cerebral cortices from control and Rer1 cKO mice on E18.5 were immunoblotted with the indicated antibodies for markers of upper layer neurons (Cux1), deep layer neurons (Ctip2), intermediate progenitors (Tbr2), apoptosis (cleaved Caspase-3), astrocyte (GFAP), and ER stress (BiP). An anti-α-Actin antibody was used as a loading control. (I-N) Quantification of immunoblot analysis of Cux1 (I), Ctip2 (J), Tbr2 (K), GFAP (L), BiP (M), and cleaved Caspase-3 (N) as shown in panel H. Graphs show fold changes of values (signal intensity of each marker normalized to that of actin) from forebrain-specific Rer1 cKO (cKO, gray bar) mice relative to control (Ctrl, black bar) mice. Error bars indicate the standard error of the mean (SEM) of six mice. **P < 0.01, ****P < 0.0001 (Student t-test). n.s.: not significant.

